
Bengt J. Olsson
LinkedIn: beos
X/Twitter: @bengtxyz
In 2025, Europe consumed about 770 TWh of electricity produced from fossil fuel sources (excluding “behind-the-meter” generation). The associated CO₂ emissions are on the order of 600 Mt per year. While this is less than 2% of global emissions, it is clearly desirable to minimize – or completely eliminate – this type of power production.
But what would that actually mean in physical and system terms? This was partly explored in a previous blog post about balancing Europe’s power system. The idea in that blog was to use the fact that all of Europe is a closed system that cannot rely on external trade for balancing.
Here, the focus is on a set of contrafactual scenarios in which fossil-fueled dispatch is substituted by increased wind and solar power production, complemented by some form of storage. The scenarios are based on hourly production data from Energy-Charts (ALL-Europe dataset), covering the EU-27 plus seven additional countries in the pan-European power system. Unfortunately, Great Britain is not included in this dataset.
Data and simplifications
To make the analysis tractable, hourly production is grouped into five categories:
- Wind
- Solar
- Fossil (all fossil variants plus the EC “Others” category, assumed mainly fossil)
- Nuclear
- AllOthers (hydro in all forms, biomass, waste, geothermal, etc.)
Hydropower accounts for more than 80% of AllOthers, followed by biomass and waste (~15%).
In the contrafactual scenarios:
- AllOthers is assumed to dispatch exactly as in 2023–2025.
It is treated as must-run. - Nuclear is also held fixed.
- Wind and Solar are weather-driven must-run sources.
- Fossil is removed and must be replaced by a dispatchable alternative.
This is a simplification. Pumped and reservoir hydro are balancing resources and would in reality dispatch differently if wind and solar were scaled up. However, since hydro tends to vary in phase with residual load, and since the shape of residual load is roughly similar in the contrafactual scenarios, this must-run assumption is defensible for a first-order analysis.
Note that the contrafactual scenarios are all based on the present level of power consumption, and not future load increases.
Observed ALL-Europe power dispatch (2023–2025)
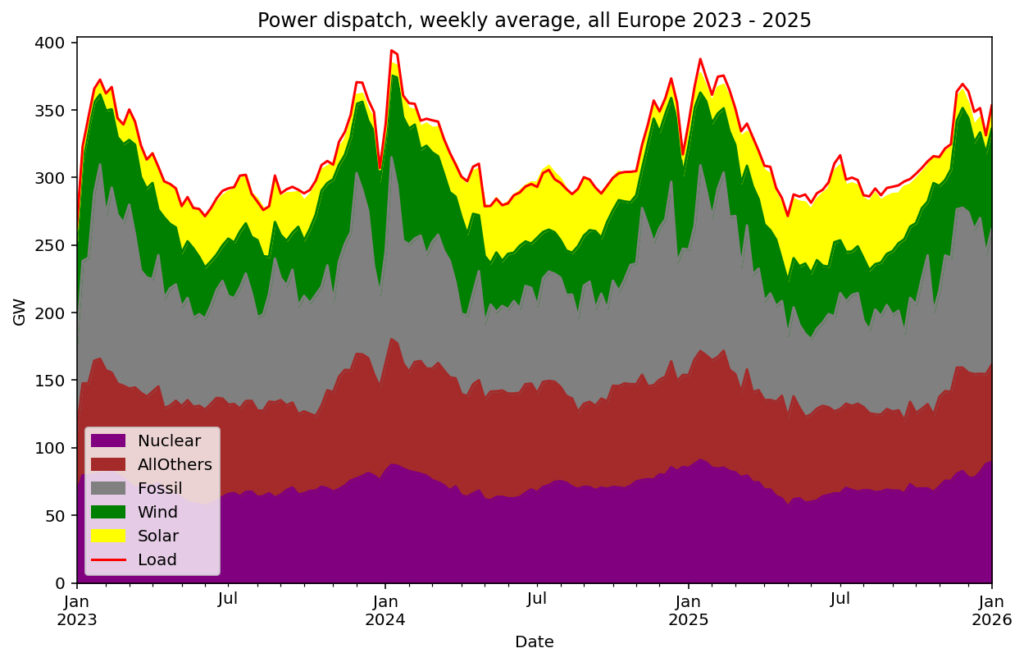
It is the grey fossil area that is target for substitution in this work.
And in tabular form (TWh/y):
+--------+--------+----------+-----------+--------+---------+-------------+--------+
|   Year |   Load |   Fossil |   Nuclear |   Wind |   Solar |   AllOthers |   diff |
|--------+--------+----------+-----------+--------+---------+-------------+--------|
|   2023 |  -2735 |      809 |       612 |    472 |     200 |         619 |    -23 |
|   2024 |  -2777 |      737 |       641 |    483 |     240 |         661 |    -15 |
|   2025 |  -2795 |      767 |       637 |    473 |     284 |         593 |    -41 |
+--------+--------+----------+-----------+--------+---------+-------------+--------+
|   Mean |  -2769 |      771 |       630 |    476 |     241 |         624 |    -26 |
+--------+--------+----------+-----------+--------+---------+-------------+--------+
Across these three years, fossil generation averages about 771 TWh/y.
Contrafactual scenario: replacing fossil with wind + solar + storage
In the next step, fossil generation is removed and replaced by:
- Increased wind and solar production, and
- A dispatchable energy store that molds this production into the same shape as the removed fossil dispatch.
Operationally, this implies:
- Wind + solar production is scaled up.
- New production substitutes fossil directly when possible.
- Excess production is stored (subject to insertion losses).
- Deficits are supplied from the store (subject to extraction losses).
Wind + solar dispatch is scaled as:
New wind + solar = X·wind_today + 2X·solar_todayThis represents a scenario where solar grows faster than wind.
For example:
Mean yearly wind ≈ 476 TWh and solar ≈ 241 TWh, then with X = 1.55:
- wind → 738 TWh
- solar → 747 TWh
- total increase ≈ 770 TWh
which matches the present mean production from fossil fuels.
Yearly energy balance
The key annual balance equation is:
- extra WS − fossil = curtail + loss_conv + deltaS/eta_in
where:
- loss = charge − delivered
- total loss = inserted to store – extracted from store
- loss_conv = loss − deltaS/eta_in
- total loss = conversion losses + net change in store level
Interpretation:
- extra WS − fossil
= surplus wind + solar built beyond what is needed to replace fossil.
This surplus is absorbed by:
- curtail
Energy spilled when the store is full. - loss_conv
Physical conversion losses in the storage chain. - dS/eta_in
Net storage build-up (store ends at a different level than it started).
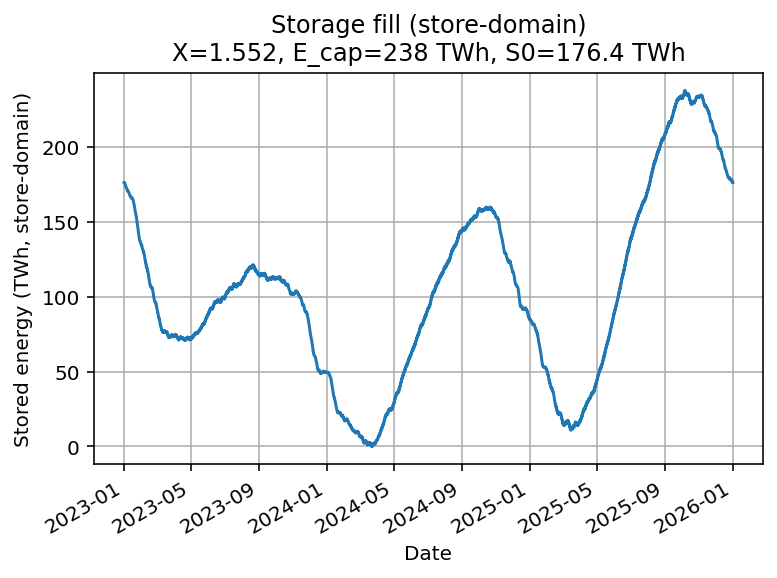
Ideal lossless store
Assume:
eta_in = 1
eta_out = 1
With no losses, replacing 770 TWh of fossil requires exactly 770 TWh of extra wind + solar.
However, the required store is not 86 TWh as given by the “virtual store” in an earlier blog.
Because wind + solar inflow is seasonal and not constant, the ideal store must be 238 TWh. Note that this is the smallest obtainable size when the best start level of the storage is selected (and no curtailment or no net storage level change).
=== Annual energy balance (TWh/y) ===
+------------+----------+-----------+-------------+----------+----------+-------------+----------+--------------+
|   extra WS |   fossil |   curtail |   loss_conv |   direct |   charge |   delivered |   deltaS |   check_year |
|------------+----------+-----------+-------------+----------+----------+-------------+----------+--------------|
|        771 |      771 |         0 |          -0 |      468 |    303.1 |       303.1 |        0 |           -0 |
+------------+----------+-----------+-------------+----------+----------+-------------+----------+--------------+
X=1.5525 | E_cap=238.0 TWh | S0=176.4 TWh | eta_in=1.000, eta_out=1.000 | minS=0.00 TWh, maxS=238.04 TWh
About 468 TWh substitutes fossil directly, and 303 TWh is delivered from the store.
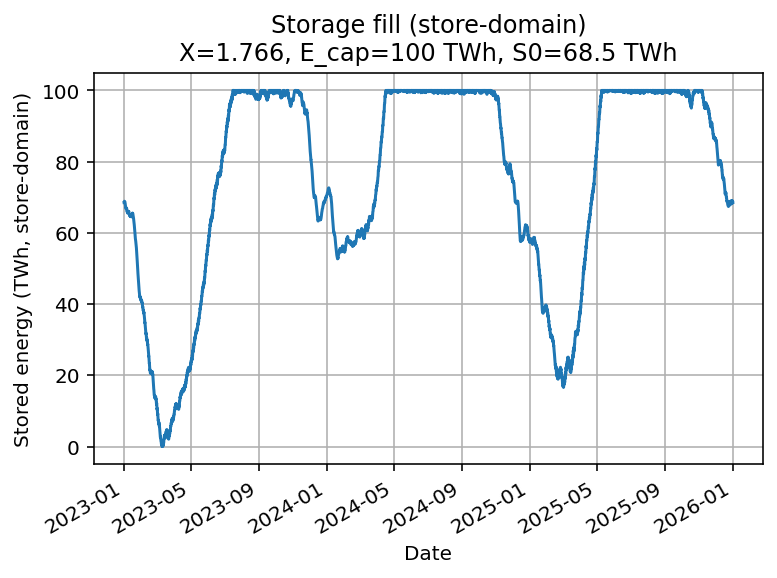
Limiting the ideal store to 100 TWh
If the ideal store is limited to 100 TWh, the system must overbuild wind + solar and accept curtailment.
=== Annual energy balance (TWh/y) ===
+------------+----------+-----------+-------------+----------+----------+-------------+----------+--------------+
|   extra WS |   fossil |   curtail |   loss_conv |   direct |   charge |   delivered |   deltaS |   check_year |
|------------+----------+-----------+-------------+----------+----------+-------------+----------+--------------|
|        976 |      771 |       205 |           0 |    541.6 |    229.4 |       229.4 |        0 |            0 |
+------------+----------+-----------+-------------+----------+----------+-------------+----------+--------------+
X=1.7663 | E_cap=100.0 TWh | S0=68.5 TWh | eta_in=1.000, eta_out=1.000 | minS=0.01 TWh, maxS=100.00 TWh
This requires 14% higher wind + solar capacity (X ≈ 1.77) and curtails 205 TWh/y.
This is a classic trade-off:
More wind + solar + curtailment
vs.
Larger storage volume
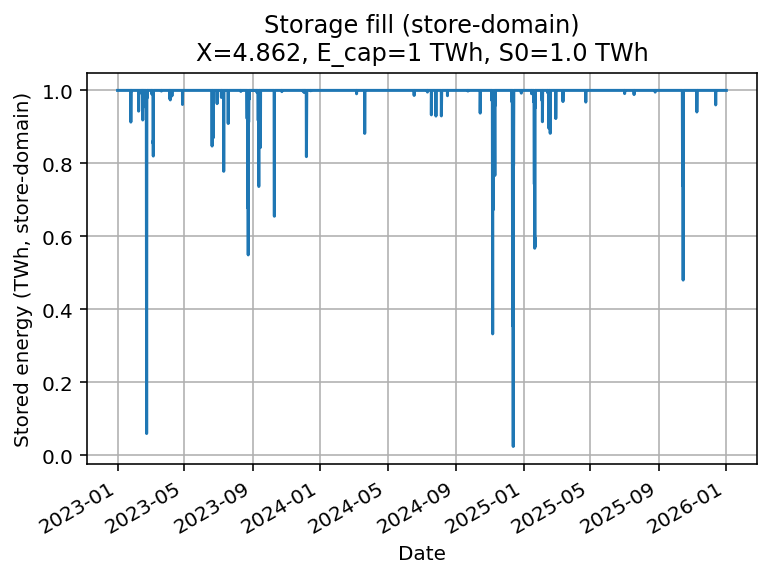
Battery storage (1 TWh)
Now consider a 1 TWh battery with:
eta_in = 0.9
eta_out = 0.9
This is purely hypothetical: batteries are not suited for seasonal storage due to cost and self-discharge.
=== Annual energy balance (TWh/y) ===
+------------+----------+-----------+-------------+----------+----------+-------------+----------+--------------+
| extra WS   |   fossil | curtail   |   loss_conv |   direct |   charge |   delivered |   deltaS |   check_year |
|------------+----------+-----------+-------------+----------+----------+-------------+----------+--------------|
| 3,943.6    |      771 | 3,171.8   |         0.7 |    767.9 |      3.8 |         3.1 |        0 |            0 |
+------------+----------+-----------+-------------+----------+----------+-------------+----------+--------------+
X=4.8617 | E_cap=1.0 TWh | S0=1.0 TWh | eta_in=0.900, eta_out=0.900 | minS=0.02 TWh, maxS=1.00 TWh
Max charger input power    : 387.1 GW
Max discharger output power: 88.9 GW
=====================================
Almost 3200 TWh/y or more than 80% of the added wind + solar is curtailed. The build-out is so large that 768 of 771 TWh are directly substituted by WS, only the remaining 3 TWh is provided through the battery store.
Charging/discharging the battery store:
- 387 GW of charging power
- 89 GW of discharging power
Conclusion:
Large-scale seasonal balancing using batteries is a non-starter.
Hydrogen storage
Finally, consider hydrogen storage with:
eta_in  = 0.6   (electrolysis)
eta_out = 0.5   (H₂ → power)
Round-trip efficiency = 30% (optimistic).
Unlimited hydrogen storage
With unlimited storage (and unlimited conversion resources) all excess energy can be stored, and hence no curtailment occur.
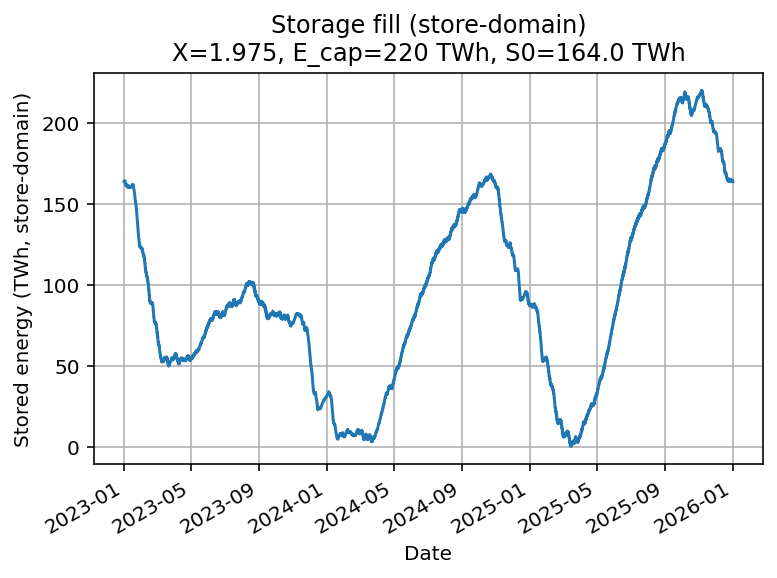
=== Annual energy balance (TWh/y) ===
+------------+----------+-----------+-------------+----------+----------+-------------+----------+--------------+
| extra WS   |   fossil |   curtail |   loss_conv |   direct |   charge |   delivered |   deltaS |   check_year |
|------------+----------+-----------+-------------+----------+----------+-------------+----------+--------------|
| 1,176.3    |      771 |         0 |       405.2 |    597.4 |    578.9 |       173.7 |        0 |            0 |
+------------+----------+-----------+-------------+----------+----------+-------------+----------+--------------+
X=1.9752 | E_cap=220.4 TWh | S0=164.0 TWh | eta_in=0.600, eta_out=0.500 | minS=0.33 TWh, maxS=220.34 TWh
Max charger input power    : 433.0 GW
Max discharger output power: 162.2 GW
=====================================
This requires:
- 433 GW of electrolyzers
- 162 GW of hydrogen turbines
All losses are conversion losses. No curtailment occurs.
Hydrogen storage limited to 60 TWh
Limiting the storage means that excess wind and solar must be curtailed, thus requiring higher generation capacity.
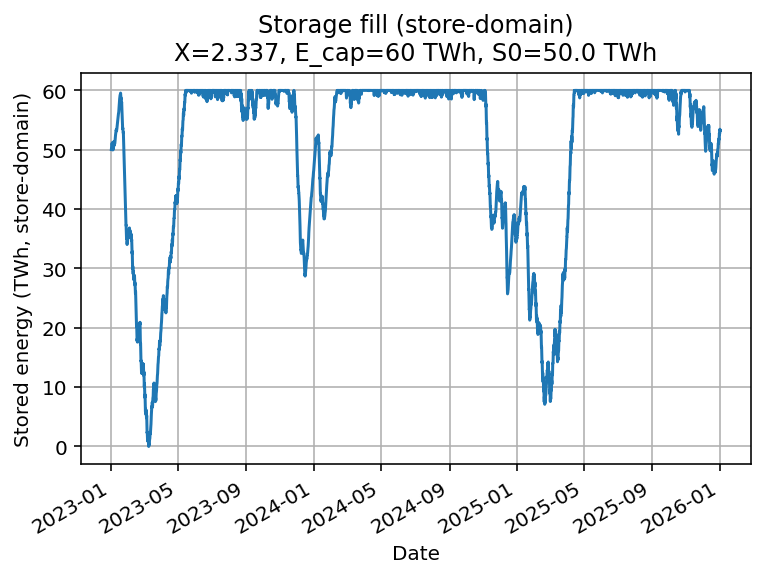
=== Annual energy balance (TWh/y) ===
+------------+----------+-----------+-------------+----------+----------+-------------+----------+--------------+
| extra WS   |   fossil |   curtail |   loss_conv |   direct |   charge |   delivered |   deltaS |   check_year |
|------------+----------+-----------+-------------+----------+----------+-------------+----------+--------------|
| 1,523.0    |      771 |     501.2 |         249 |    664.3 |    357.5 |       106.7 |      1.1 |           -0 |
+------------+----------+-----------+-------------+----------+----------+-------------+----------+--------------+
X=2.3368 | E_cap=60.0 TWh | S0=50.0 TWh | eta_in=0.600, eta_out=0.500 | minS=0.00 TWh, maxS=60.00 TWh
Max charger input power    : 521.6 GW
Max discharger output power: 153.0 GW
=====================================
This requires:
- 522 GW of electrolyzers
- 153 GW of hydrogen turbines
- ~500 TWh/y curtailment
The increased wind and solar generation capacity implies higher conversion capacity (electrolyzers in this case), but slightly lower gas turbine capacity.
Hydrogen as an industrial feedstock
In all scenarios above, hydrogen is used exclusively as a power-system buffer to replace fossil electricity. In reality, however, hydrogen is primarily envisaged as an industrial feedstock for steel, chemicals, and synthetic fuels.
If industrial hydrogen demand is supplied from the same storage system, this corresponds to a continuous additional draw from the store. In the annual energy balance, this adds a new term:
extra WS − fossil ≈ curtail + loss_conv + deltaS/eta_in + H2_ind/eta_inwhere H2_ind is the annual industrial hydrogen demand in the storage domain.
This has three direct system-level consequences:
- seasonal storage volumes increase further,
- renewable overbuild increases,
- conversion losses increase,
- electrolyzer capacity requirements increase,
while curtailment is reduced only marginally. In other words, using hydrogen simultaneously as an industrial feedstock and as a seasonal electricity buffer makes the storage and overbuild problem strictly worse, not better.
A hypothetical counterfactual would be to offset industrial hydrogen withdrawals with an equal and constant external hydrogen inflow into the store, for example via imports. In that case, the net storage dynamics would be unchanged, and none of the power-system related results above would be affected.
Conclusions
- Seasonal storage requirements are enormous, even in idealized lossless systems.
- Batteries are unsuitable for seasonal balancing.
- Hydrogen can work physically, but:
- requires massive overproduction,
- large storage volumes,
- extreme peak conversion capacity requirements.,
- and accepts huge conversion losses.
Replacing fossil electricity with wind, solar, and storage at continental scale is not just a storage and efficiency problem — it also entails significant renewable overbuild. Substituting coal and gas with dispatchable low-carbon power, most obviously nuclear, would directly reduce storage needs, curtailment, and conversion losses.