
Bengt J. Olsson
LinkedIn: beos
X/Twitter: @bengtxyz
Following up on the European-wide balancing analysis, this post zooms in on the Nordic-Baltic block — seven countries (Sweden, Norway, Denmark, Finland, Estonia, Latvia, Lithuania) that share a tightly integrated power market. The NB7 system looks very different from Europe as a whole, and the reasons are instructive.
Power dispatch in NB7
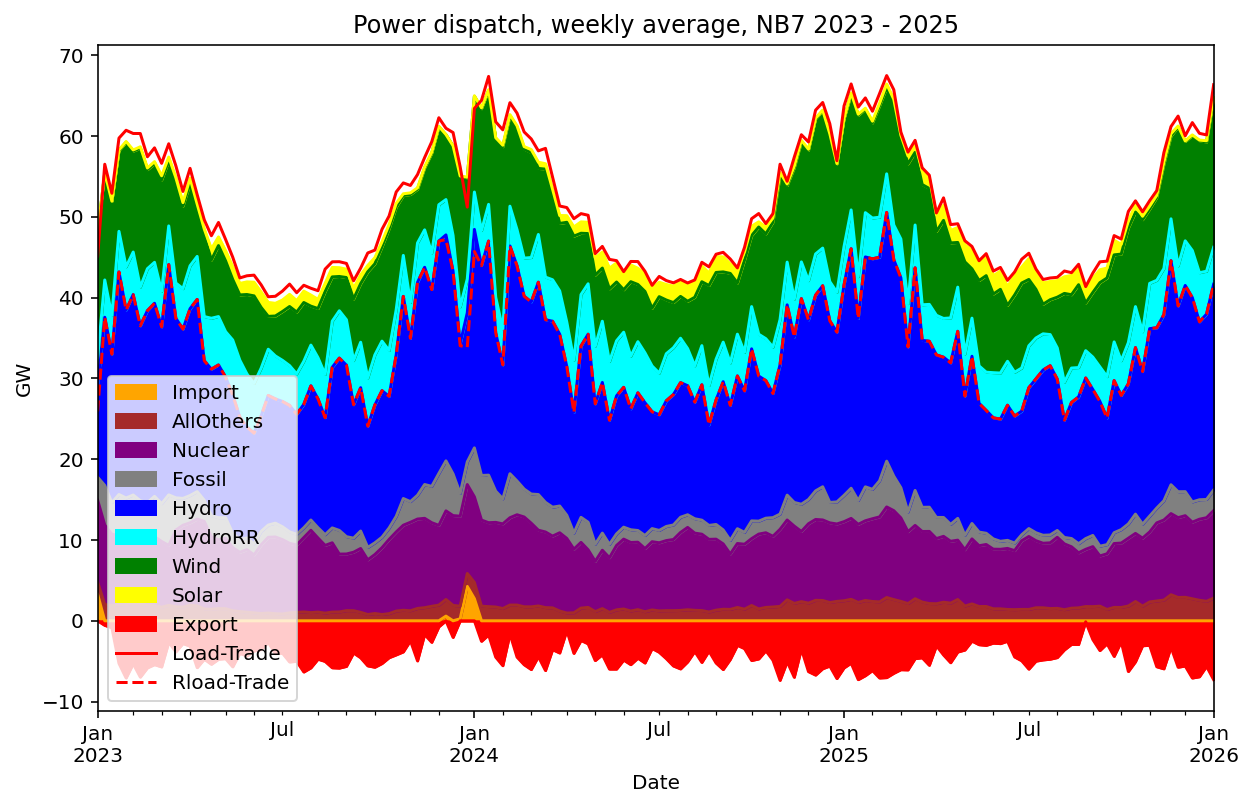
Below the combined countries power dispatch is grouped into relevant categories and graphed. Using the equalities
- Production + Import = Consumption + Export, and
- Trade = Import – Export
=> - Production = Consumption – Trade
We can see that the red line, (Load/Consumption – Trade) matches the total Production fairly well. The difference is here attributed to reporting inconcistencies. The dotted red line, residual load, coincides with the sum up to the hydro reservoir by design (residual load is Σ of all dispatchable sources).
In numbers the dispatches are given below (in TWh):
+--------+--------+----------+-----------+--------+---------+---------+-------------+---------+--------+
|   Year |   Load |   Fossil |   Nuclear |   Wind |   Solar |   Trade |   AllOthers |   Hydro |   diff |
|--------+--------+----------+-----------+--------+---------+---------+-------------+---------+--------|
|   2023 |   -405 |       26 |        79 |     85 |       7 |     -35 |          12 |     220 |    -11 |
|   2024 |   -415 |       24 |        80 |     99 |      10 |     -40 |          14 |     220 |     -8 |
|   2025 |   -416 |       19 |        76 |     98 |      11 |     -40 |          18 |     227 |     -7 |
+--------+--------+----------+-----------+--------+---------+---------+-------------+---------+--------+
A feature that distinguishes the NB7 system from the Pan-European (PanE) system is the higher seasonal variability. Most interestingly the NB7 has 36% higher variability of residual load, compared to PanE when measuring (Rload_95% – Rload_5%)/Rload_mean. This is typical for the more northern placement of NB7 vs PanE, with higher heating demand in the winter.
Another feature is the dominance of export in the trade. On a weekly average, as in the figure above, trade is almost entirely export. The exception is around new year 2023-2024 when Statnett in Norway held back on its hydro production and relied on imports for a couple of weeks, probably due to low demand an low import prices over the holidays.
A Hydro-Dominated System
The NB7 energy mix for 2023–2025 leaves little room for ambiguity. Hydro accounts for over half of all generation, nuclear for another 18%, and wind for 21%. Fossil fuels contribute just 5%, a fraction of the European average.
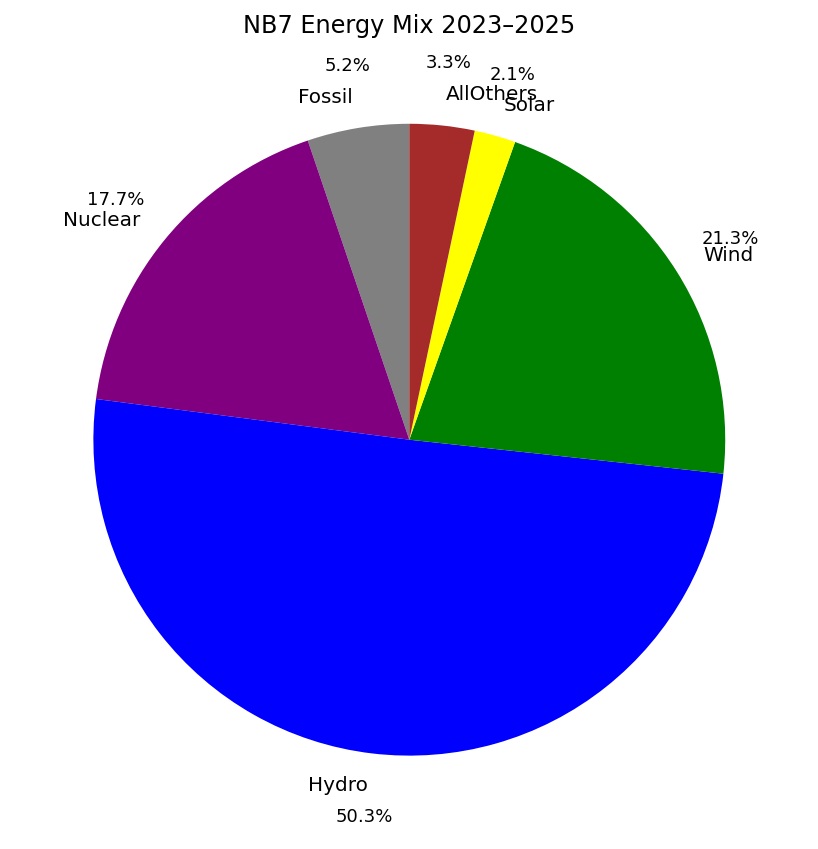
As can be seen, this system has already largely transitioned away from fossil.
Measuring Balancing Contributions
The previous analysis used a covariance method to quantify how much each source contributes to balancing the residual load — the portion of demand not covered by must-run renewables. Specifically, the balancing share of each source is defined as its covariance with residual load, normalised by the total variance of residual load. The shares sum to one by construction.
In the previous post, the PanE system was treated as a closed system where trade between countries summed up to zero. When just looking at the NB7 region, this assumption does not hold, and trade actually plays an active role in the balancing, as will be seen below.
Applying the same method to NB7 across three time horizons — hourly, weekly, and quarterly — gives the following picture.
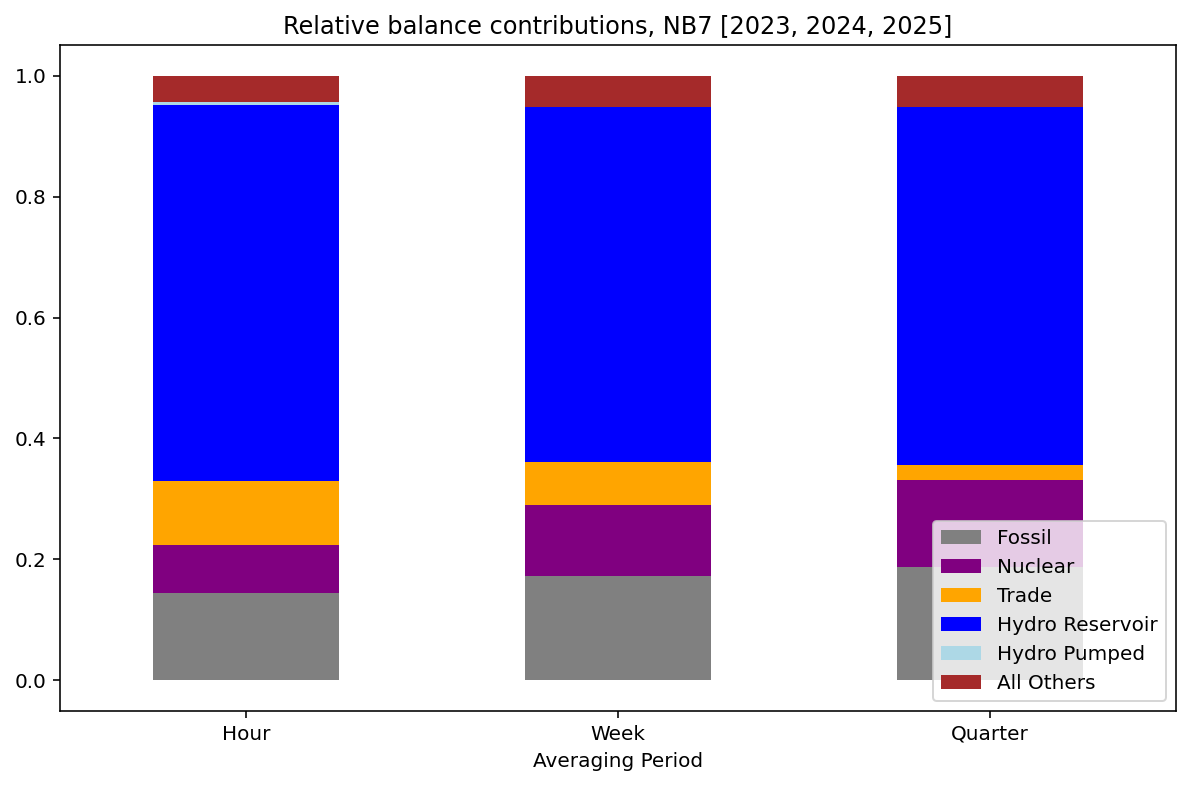
Reservoir hydro is the dominant balancing source at every time scale, with a similar 60% share as fossil has in the PanE system. Fossil, mainly in Denmark and the Baltic states, here contributes below 20%. Nuclear shows a similar trend that is seen also in the PanE system, in that it provides an important seasonal balancing component, through scheduled summer maintenance outages. Trade, NB7’s net cross-border flow with the rest of Europe, shrinks from around 11% hourly to barely 2% quarterly.
Since trade is a new balancing factor here compared to the PanE case, it can be interesting do dive a little bit deeper into it.
What Actually Drives Trade?
To probe this further, we can compute the correlation between net trade and every generation source across the three time horizons. The result is striking in its lack of any dominant driver. All correlations are weak (below 0.4 in absolute terms), which is itself informative: trade is not wind export in disguise, nor hydro overflow, nor any other single phenomenon. It is a market response to system-wide price gradients.
  Source      |  Hourly |  Weekly | Quarterly
  ------------|---------|---------|----------
  Wind        |  -0.262 |  -0.144 |    -0.282
  Solar       |  +0.298 |  -0.002 |    +0.120
  HydroRR     |  -0.215 |  -0.327 |    -0.171
  HydroWR     |  -0.187 |  -0.083 |    -0.078
  HydroP      |  -0.244 |  +0.068 |    +0.228
  Nuclear     |  +0.001 |  +0.031 |    +0.029
  Fossil      |  +0.090 |  +0.140 |    +0.057
  AllOthers   |  -0.121 |  -0.162 |    -0.392
Correlation with Trade for NB7.
A few details stand out. Wind and run-of-river hydro are consistently negative — when these must-run sources produce more, NB7 tends to export more, as expected. But the strongest hourly correlation is actually positive: solar at +0.30. More solar means more import, or less export. The likely explanation is that sunny conditions in NB7 coincide with sunny conditions across Europe, which depresses continental prices and makes NB7 exports less profitable. Trade responds to relative prices, not to local surplus alone.
Nuclear shows essentially zero correlation with trade at every time scale — consistent with its role as pure baseload, dispatched without regard to market conditions. Reservoir hydro, despite being the dominant balancing source internally, has only a weak negative correlation with trade, suggesting it is primarily optimised against domestic demand rather than export opportunities.
This aggregate NB7 picture, however, conceals important country-level differences. For Sweden individually, the Wind–Trade correlation is substantially
stronger: −0.46 at the hourly scale, −0.39 weekly, and −0.69 quarterly. At the quarterly level, wind alone explains nearly half the variance in Swedish net
exports. In other words, for Sweden, trade is largely wind export — the country exports when the wind blows and pulls back when it does not. This signal is diluted at the NB7 level because Norwegian reservoir hydro, which responds to water inflow and seasonal demand rather than wind, dominates the aggregate trade pattern. The two largest NB7 members thus export for fundamentally different reasons.
This brings us back to why Trade’s balancing contribution fades with the averaging period. It is not that trade becomes less active — it is that its drivers
are short-lived. Price gradients between NB7 and the continent arise and dissolve within hours to days, producing flows that oscillate without building a persistent seasonal pattern. Norwegian reservoir hydro, by contrast, follows the slow rhythm of snowmelt and winter demand — a cycle measured in months, not hours. At the quarterly scale, hydro’s seasonal signal dominates completely, and trade’s rapid oscillations have averaged away to near zero.
What This Means
The NB7 result stands in sharp contrast to the PanE picture, where fossil power provides around 60% of balancing at every time scale. In NB7, reservoir hydro fills that role.
This has one important implication for the broader European transition. The flexibility that makes NB7 work is not replicable at scale elsewhere in Europe. Norwegian and Swedish reservoir capacity represents a very particular geography. Expanding interconnection with NB7, which has been a recurring policy proposal, can export some of that flexibility to the continent, but the resource itself is finite.
Data source: https://energy-charts.info, via the public API. Analysis covers 2023–2025.