
🇮🇪
Bengt J. Olsson
X: @bengtxyz
LinkedIn: beos
How can an island like Ireland reach net-zero by 2050? In the modelling here, two distinct pathways
are presented – one fully renewable, and one with a significant nuclear share.
Ireland is a particularly interesting case for energy system modelling. As an island, it requires a high degree of self-sufficiency in its energy supply. At the same time, interconnection capacity is being expanded: the new Celtic Interconnector to France, together with the existing Moyle and EWIC links, will bring total interconnector capacity to about 1.7 GW.
The main domestic power sources considered for Ireland are onshore and offshore wind, solar, gas, and biomass. While gas and biomass both carry climate impacts and relatively high costs, they are included in this study for completeness. Nuclear power at different cost levels is also tested as part of the scenario set.
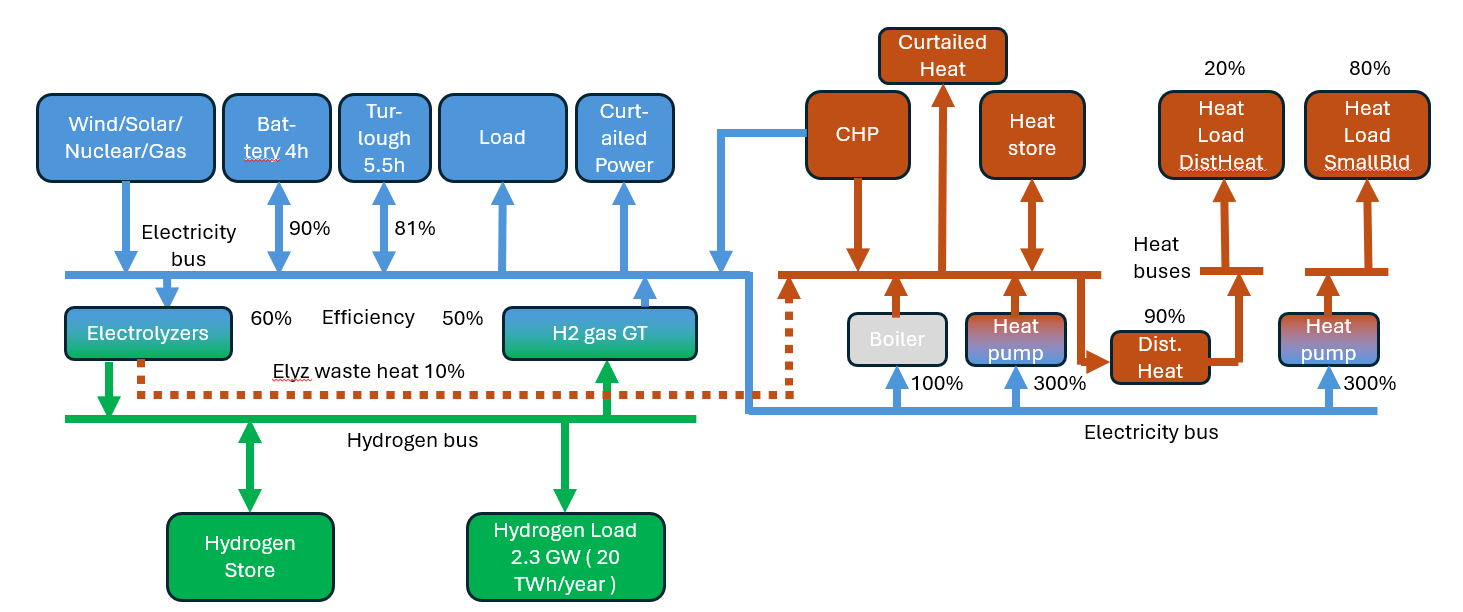
The model itself is a slightly adapted version of the sector-coupled framework described in this post. Ireland is represented as a one-node (“copper-plate”) system with three interacting sectors: Power, Hydrogen, and Heat. Power generation and load data for 2023–2024 was obtained from EirGrid (for All Ireland, including Northern Ireland) to build realistic dispatch and load profiles. For offshore wind, German offshore wind production data over the same period was used as a proxy, since Irish offshore statistics are not yet available.
(Jump to summary)
The resulting model looks like this:
Load assumptions
The 2050 target system is inspired by the MaREI model (see Figure 6 in this report), but with a number of modifications. The assumed final energy consumption is structured as follows:
- Power demand:
Current electricity consumption of about 40 TWh is increased by an additional 20 TWh for transport electrification and 10 TWh for general demand growth (data centers, industrial processes, etc.). In the model, this additional 30 TWh is represented as a fixed load addition of 3.4 GW to the 2023/2024 hourly load. - Hydrogen demand:
A demand of 20 TWh (LHV) hydrogen is assumed for the Power-to-X sector. In addition, further hydrogen can be produced for power generation in hydrogen turbines if this proves economical within the optimization. - Heat demand:
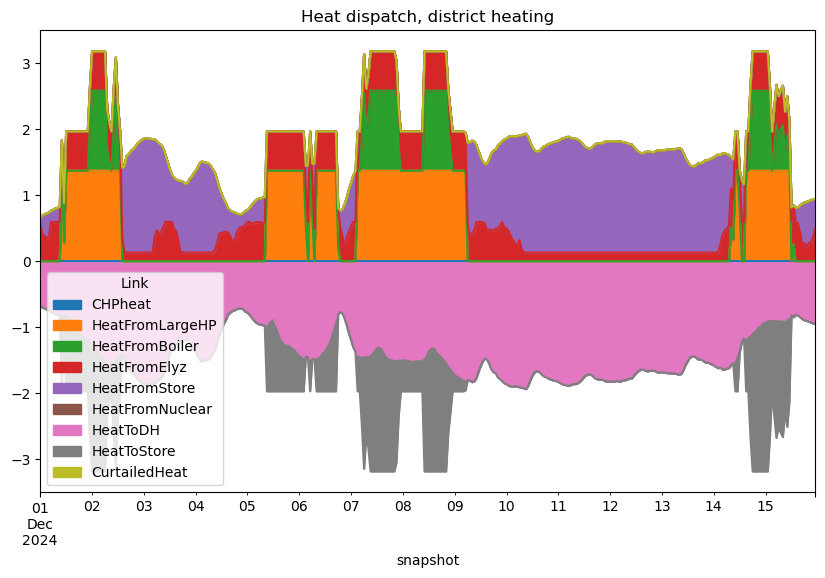
Approximately 35 TWh of current gas and oil heating is assumed to be converted to electrified heating and district heating. Of this, 20 % is allocated to district heating and 80 % to direct electrification with heat pumps (COP = 3). The demand profile was extracted from hourly temperature data for Ireland for the period.
Wind power assumptions
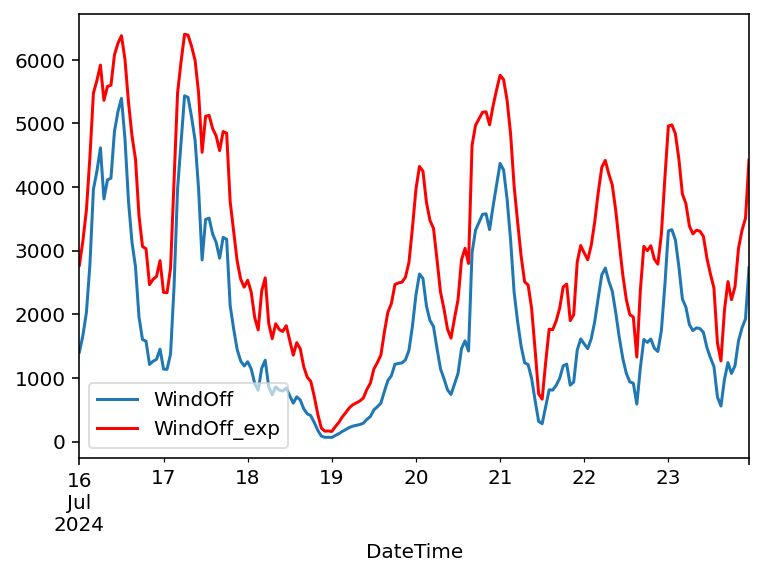
For Irish onshore wind, the capacity factor today is estimated at 25%, using production and installed capacity data from EirGrid. For offshore wind, German offshore data from EnergyCharts was used as a proxy for future Irish conditions, giving an estimated offshore capacity factor of 32%, accoding to the EnergyCharts data.
Capacity factors are expected to improve over time, but the extent of that improvement is uncertain. To explore the impact of stronger capacity factors, both onshore and offshore wind were rescaled using an exponentially weighted method. This approach increases output proportionally more at low power levels while leaving maximum output unchanged, effectively making wind behave more like “base load” power.
It should also be noted that using scaled German offshore wind as a proxy for future Irish offshore generation is very likely to underestimate the correlation between onshore and offshore wind in the model. This, in turn, further enhances the baseload-like character of wind power.
In the rescaled scenarios, the onshore capacity factor was lifted from 25% to 30% (+20%) and the offshore factor from 32% to 50% (+56%).
Another key assumption concerns Ireland’s onshore wind potential. Wind Energy Ireland estimates this potential at 11.5 GW by 2050, but this figure refers only to the Republic. Since this analysis covers the entire island, the maximum onshore wind capacity is set at 15 GW. Given the relatively low cost of land-based wind, it is assumed that this capacity will be fully built out. Beyond that, other power sources compete to supply the remaining electricity required to balance demand.
CHP and Gas assumptions
Combined Heat and Power (CHP) plants are assumed to be biomass-fueled and have fixed 50% efficiency for heat and 35% for power. Gas turbines are modeled with Carbon Capture and Storage (CCS), achieving 90 % CO₂ removal. The effective fuel cost for these plants is set at 80 EUR/MWh of produced electricity, consisting of a methane price of 30 EUR/MWh and an assumed 20 EUR/MWh CO₂ ETS cost. The same 30 EUR/MWh cost is assumed for biomass for CHP.
Nuclear assumptions
Nuclear power has a production profile with lower production in th summer due to revisions then, and occasional failure dips. Nuclear can slowly load-follow (6h/unit power), but only down to 50% of the peak capacity. The profile has a 86.7% capacity factor, but this factor will decrease with nuclear load following.
In the nuclear scenario, nuclear power is assumed at a cost of €6 billion per GW. Compared to today’s cost levels this may seem low, but with increased deployment and industrial learning it could be a realistic figure by 2050. For reference, NREL’s Annual Technology Baseline (moderate case) projects nuclear at about $5 billion per GW in 2050.
It is also worth noting that NREL/ATB estimate the cost of floating offshore wind in 2050 at $4.3 billion per GW, while this study uses only €2.2 billion per GW for offshore wind. This alone indicates a positive bias towards offshore wind in the analysis—an impression further reinforced by the strong scaling of wind data to achieve higher capacity factors, giving wind power an almost baseload-like properties.
Results and discussion
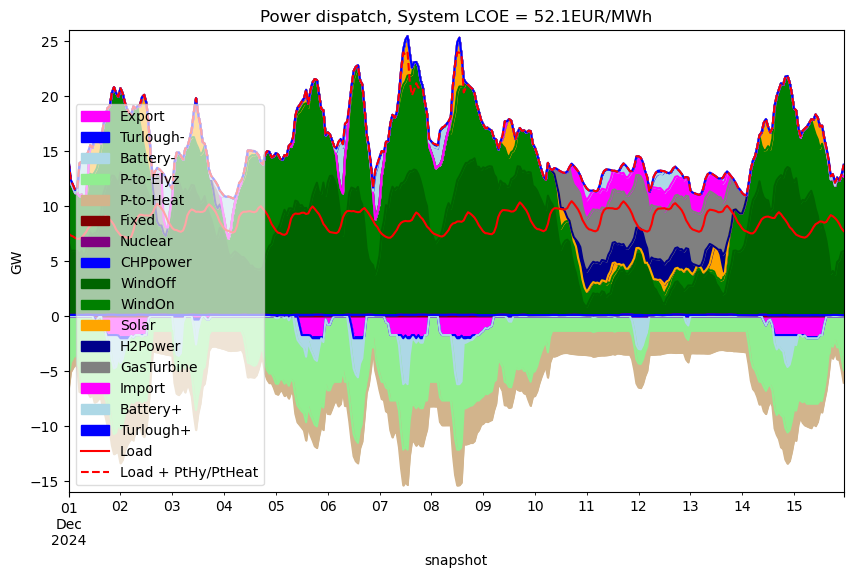
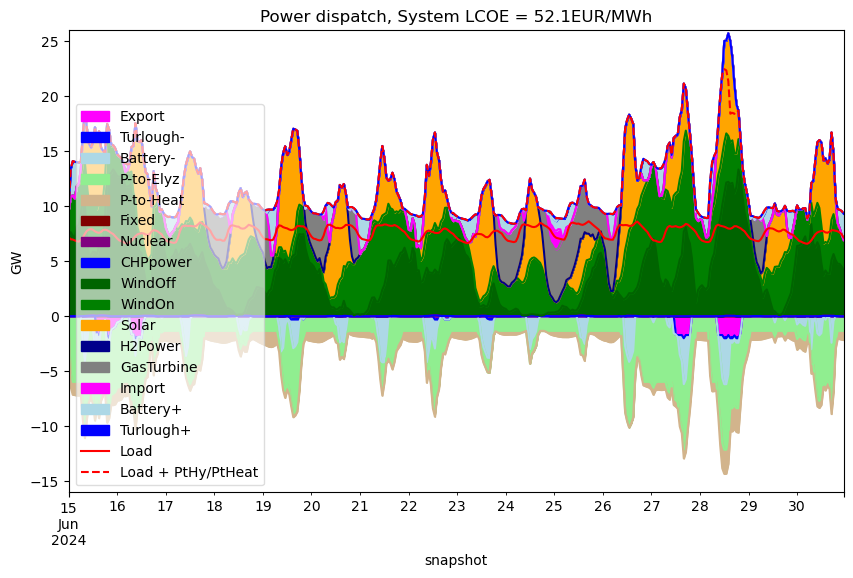
The image below illustrates the overall energy flows within and across the sectors.
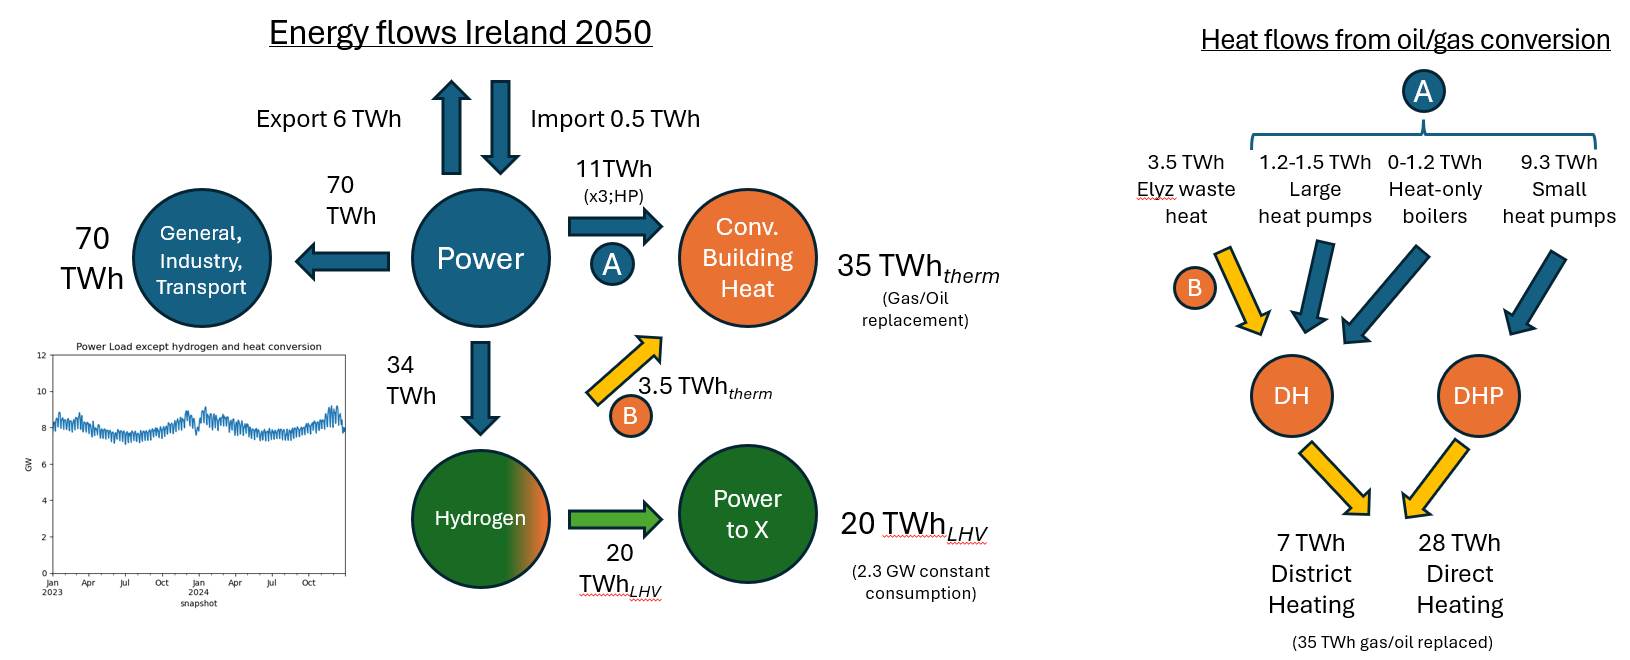
70 TWh are consumed across domestic, commercial, industrial, and transport sectors. An additional 35 TWh is used for hydrogen production. Around 11 TWh goes towards converting gas and oil heating systems to heat pumps and district heating. Approximately 3.5 TWh of heat from electrolyzers is injected into the district heating system, though this figure is somewhat arbitrary. The combination of 3 x 11 plus 3.5 TWh (minus some losses in district heating distribution) meets the demand for 35 TWh of heating.
This is the overall picture, and it doesn’t vary significantly with the choice of power production mix. Now, let’s take a closer look at this production mix!
Nuclear or more renewable/gas?
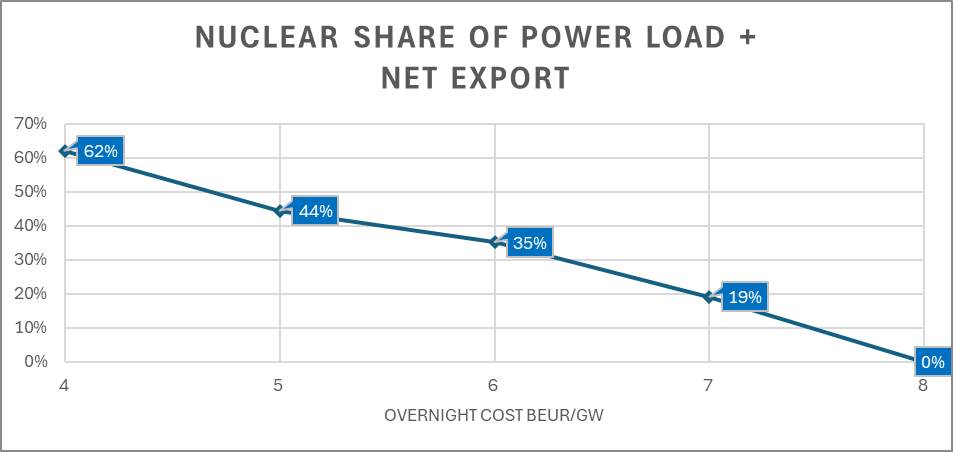
The trend is clear: varying the cost of nuclear significantly impacts the production mix, mainly shifting between nuclear and renewables with enabling gas. Other factors in the mix, like increased use of batteries, hydrogen storage, and to some extent heat storage, also change, but these shifts are relatively minor compared to the main factors mentioned.
Here is the nuclear share of the system’s energy production as a function of nuclear cost.
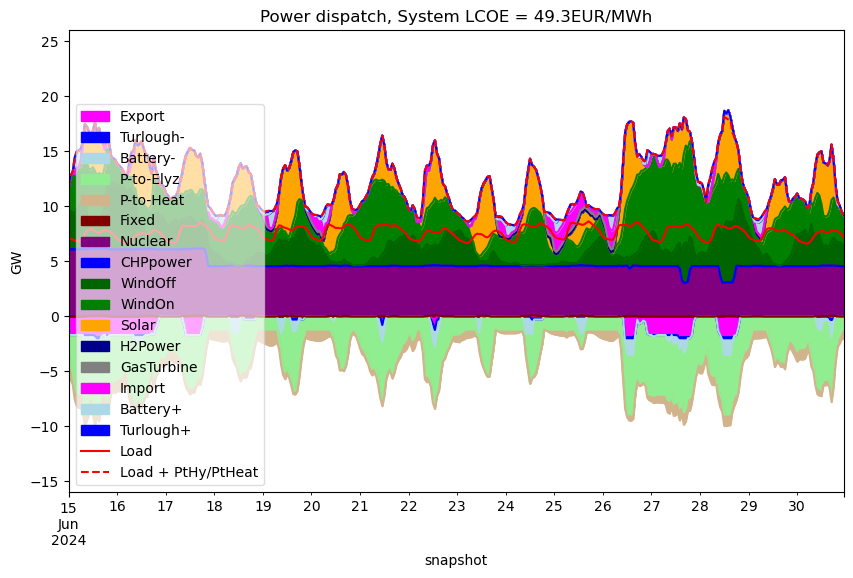
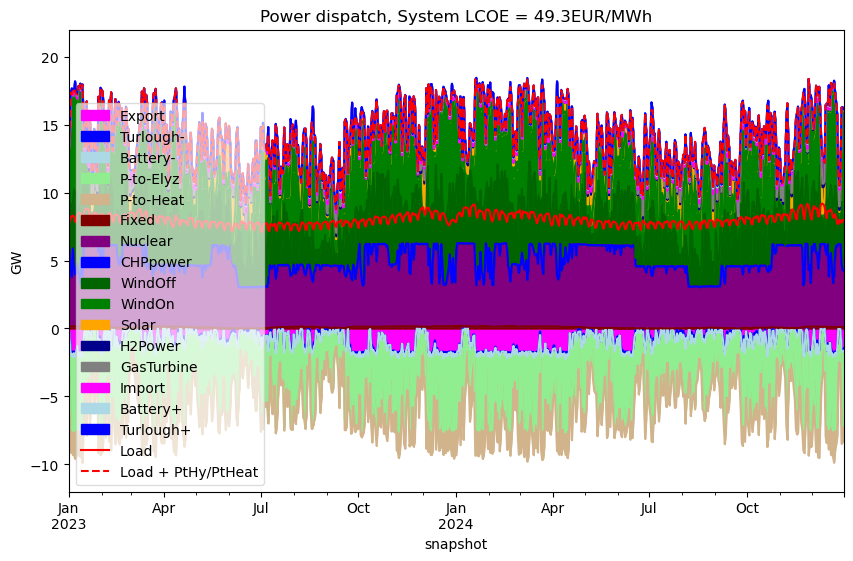
Side-by-side comparison of scenarios
Let’s compare two scenarios: one fully renewable system, without nuclear, and one where nuclear energy has a CAPEX cost of 6 BEUR/GW.
Fully renewable system
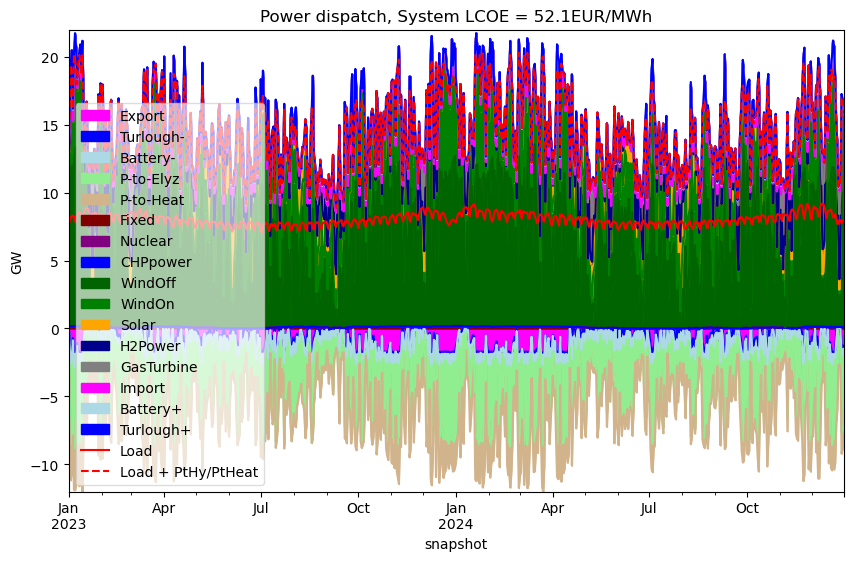
Power bus (TWh electricity)
===========================
WindOn            39.3
WindOff           63.3
Solar             15.3
Nuclear            0.0
Fixed              0.8
CHPpower           0.0
H2Power            0.2
GasTurbine         5.3
Battery+           3.2
Battery-          -3.9
P-to-Elyz        -34.2
PowerToLargeHP    -1.2
PowerToHeat       -1.2
PowerToSmallHP    -9.3
Load             -70.4
Curtailed         -2.0
Import             0.4
Export            -5.7
Turlough-         -0.2
Turlough+          0.2
dtype: float64
Balance power bus     :  0.0

Hydrogen bus (TWh H2 LHV)
=========================
H2fromElyz     20.5
H2toCCGT       -0.4
H2toPowX      -20.0
H2FromStore     5.5
H2ToStore      -5.6
dtype: float64
Balance hydrogen bus  : -0.0

Heat store bus (TWh heat)
=========================
Link
HeatFromElyz       3.4
HeatFromCCGT       0.0
HeatFromNuclear    0.0
CHPheat            0.0
HeatFromLargeHP    3.5
HeatFromBoiler     1.2
HeatFromStore      3.4
HeatToStore       -3.7
HeatToDH          -7.8
CurtailedHeat     -0.0
dtype: float64
Balance heat store bus: -0.0
Loads (TWh power/H2_LHV/heat)
========================
Power loads 116.2
Hydrogen 20.0
HeatLoadDH 7.0
HeatLoad 28.0
Generators (GW)
========================
WindOn 15.0
WindOff 16.8
Solar 25.2
Fixed 0.2
Curtailed 11.0
CurtailedHeat 0.6
H2Turbine 1.9
GasTurbine 4.8
Nuclear -0.0
CHP -0.0
Export 1.7
Import 1.7
Storage (GWh)
======================
Battery 16.7
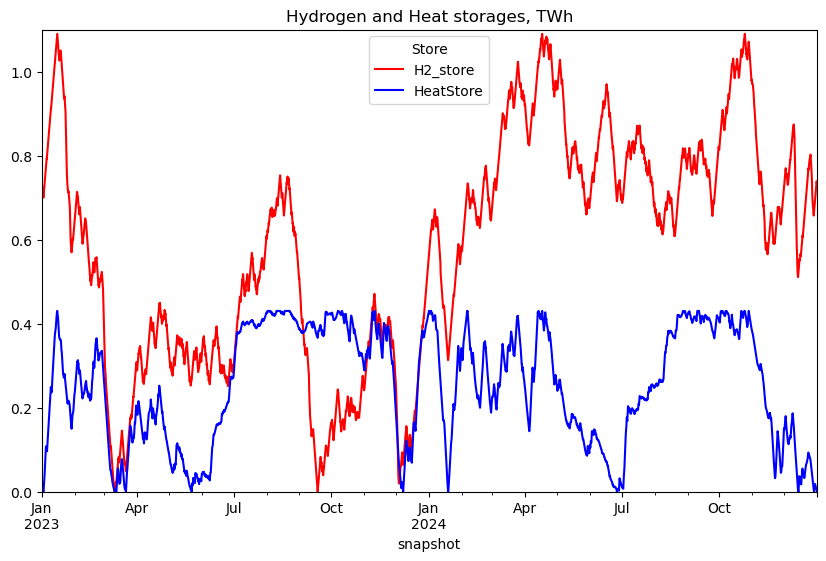
Hydrogen 1089.7
Heat 430.1
Others
======================
Elyz capacity 6.6 GW
CO2 released 0.21 Mt
Total ann. cost 8.33 B€
Peak power 28.7 GW
Nuclear @ 6BEUR/GW
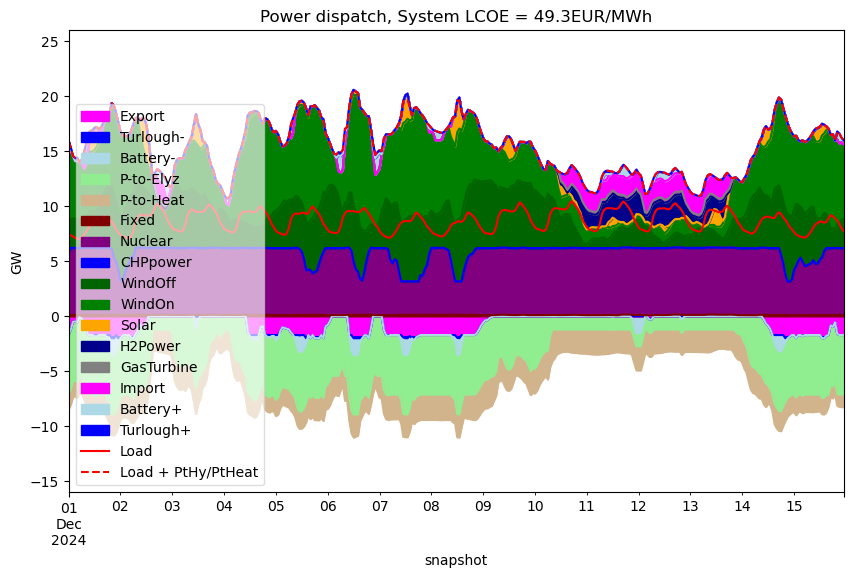
Power bus (TWh electricity)
===========================
WindOn            39.3
WindOff           28.8
Solar              9.7
Nuclear           43.1
Fixed              0.8
CHPpower           0.0
H2Power            0.3
GasTurbine         0.2
Battery+           1.2
Battery-          -1.4
P-to-Elyz        -34.5
PowerToLargeHP    -1.5
PowerToHeat        0.0
PowerToSmallHP    -9.3
Load             -70.4
Curtailed         -0.3
Import             0.7
Export            -6.8
Turlough-         -0.3
Turlough+          0.2
dtype: float64
Balance power bus     :  0.0

Hydrogen bus (TWh H2 LHV)
=========================
H2fromElyz     20.7
H2toCCGT       -0.7
H2toPowX      -20.0
H2FromStore     4.5
H2ToStore      -4.5
dtype: float64
Balance hydrogen bus  : -0.0

Heat store bus (TWh heat)
=========================
Link
HeatFromElyz       3.5
HeatFromCCGT       0.0
HeatFromNuclear    0.0
CHPheat            0.0
HeatFromLargeHP    4.5
HeatFromBoiler     0.0
HeatFromStore      2.9
HeatToStore       -3.0
HeatToDH          -7.8
CurtailedHeat     -0.0
dtype: float64
Balance heat store bus: -0.0
Loads (TWh power/H2_LHV/heat)
========================
Power loads  115.7
Hydrogen      20.0
HeatLoadDH     7.0
HeatLoad      28.0

Generators (GW)
========================
WindOn           15.0
WindOff           7.6
Solar            16.0
Fixed             0.2
Curtailed         4.7
CurtailedHeat     0.5
H2Turbine         2.2
GasTurbine        0.3
Nuclear           6.1
CHP              -0.0
Export            1.7
Import            1.7

Storage (GWh)
======================
Battery           6.1
Hydrogen        487.3
Heat            229.1

Others
======================
Elyz capacity    6.0 GW
CO2 released    0.01 Mt
Total ann. cost 7.92 B€
Peak power      22.2 GW
Nuc cap factor  80.6 %
Summary
In summary, the main differences between the two scenarios in terms of dispatch are that in the nuclear plus renewable scenario, nuclear replaces 43 TWh of offshore wind, solar and gas from the fully renewable scenario.
| Difference analysis | Fully Renewable (TWh) | Nuclear @ 6 BEUR/GW (TWh) | Difference (TWh) |
|---|---|---|---|
| Wind – Onshore | 39.3 | 39.3 | 0 |
| Wind – Offshore | 69.3 | 28.8 | -34.5 |
| Solar | 15.3 | 9.7 | -5.6 |
| Nuclear | 0 | 43.1 | +43.1 |
| Gas | 5.3 | 0.2 | -5.1 |
Main differences
Replacing 43 TWh of renewable/gas with nuclear energy has several impacts on the system:
- A more compact system – Peak power demand falls from 29 to 22 GW, which likely eases the burden on the transmission network.
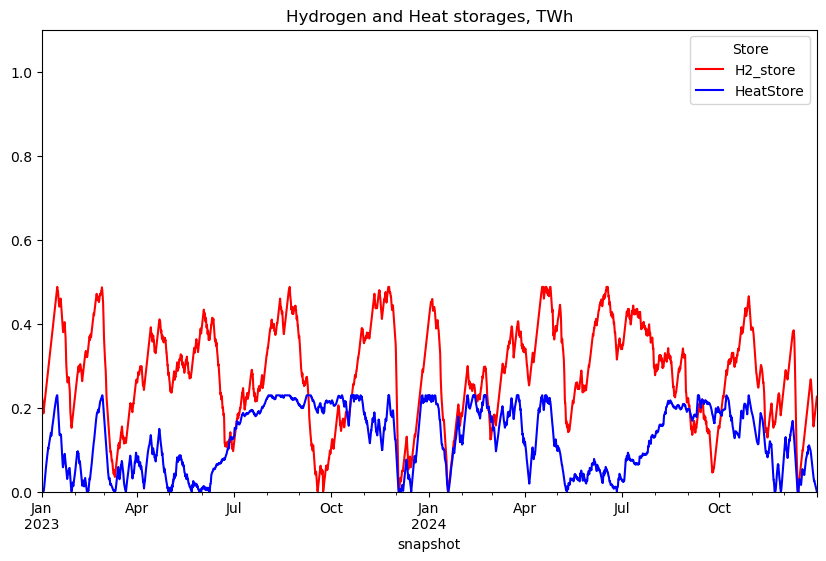
- Reduced storage needs – Battery capacity drops from 17 to 6 GWh ( -65%), while required heat and hydrogen storage volumes shrink by ~50%.
- Increased stability – While not part of this work, 6 GW of nuclear power would contribute significantly to the system inertia and the handling of reactive power.
- Lower annual system cost – Total costs decrease by about 5%, equivalent to roughly €410 million per year.
- This cost reduction should however be viewed as highly indicative, since it depends on many uncertain assumptions.
- Lower release of CO₂ due to minimal use of fossil gas
Other Observations
- As expected, onshore wind power is utilized to its maximum capped capacity in alla scenarios, 15 GW, corresponding to 39 TWh @ 30% capacity factor.
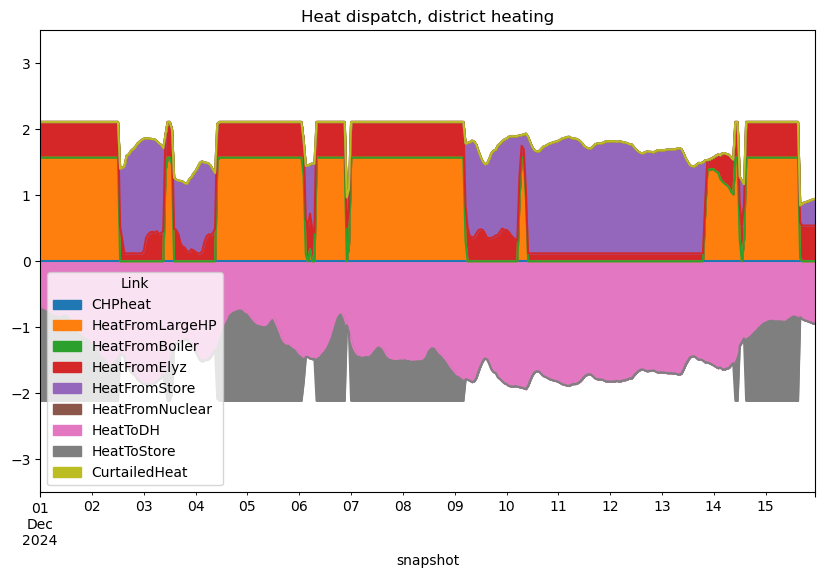
- Combined Heat and Power (CHP), fuelled by biomass, is largely squeezed out of the optimisation due to its relatively high cost.
- Instead, large-scale heat pumps and excess heat from electrolyser operation supply the district heating system.
- Nuclear heat is not utilised in this model, but in reality it could be an important source for district heating.
- The fully renewable scenario relies more on heat-only boilers, likely to make use of excess solar/wind power that would otherwise be curtailed.
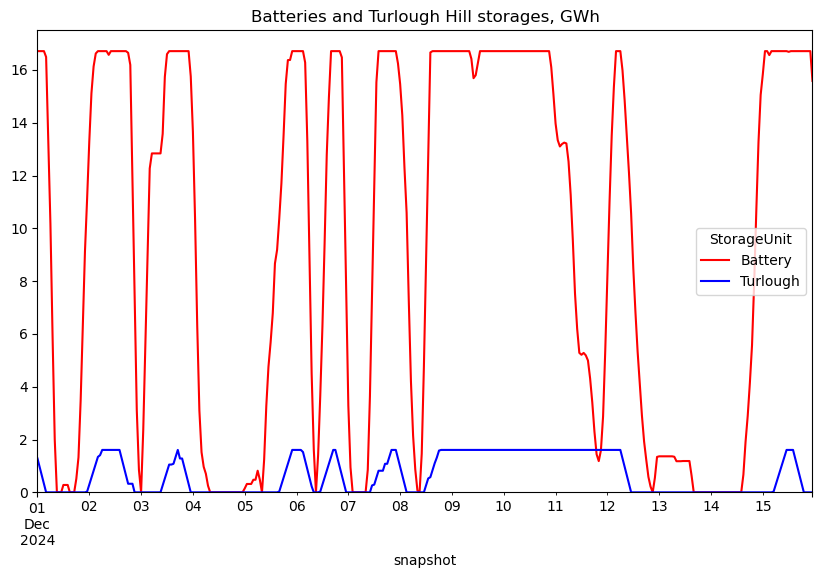
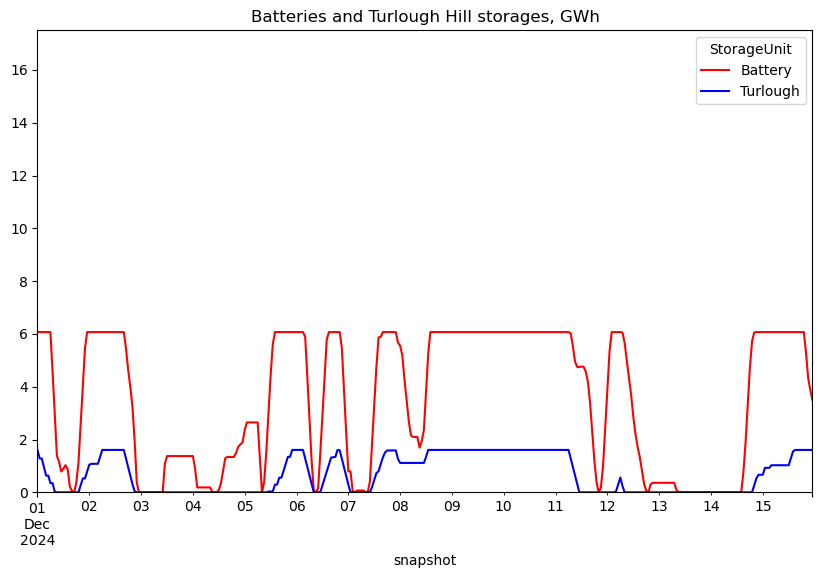
- The Turlough Hill pumped hydro plant is too small to have a noticeable effect at the system level.
- Instead, 6-17 GWh of battery storage is used for daily balancing.
- Very little fossil gas is used in the nuclear + renewable case, only ~200 GWh. This gas flexibility could readily be handled by the other flexibility sources (hydrogen, batteries).
Appendix: Cost assumptions
| Asset | Overnight cost (MEUR/MW) | FOM (% of OC) | VOM (Marginal cost) (EUR/MWh) | Lifetime |
|---|---|---|---|---|
| Solar | 0.33 | 3% | 0.5 | 25 |
| Wind – Onshore | 1.1 | 2% | 1 | 25 |
| Wind – Offshore | 2.2 | 2% | 2 | 25 |
| Gas turbine (H2/NG) | 1 / 1.5 | 2% | 4 / 82.5 | 25 |
| Nuclear | 6 | 2% | 10 | 60 |
| Combined heat/power | 1 (per MW fuel) | 3% | 32.5 (per MWh fuel) | 40 |
| Electrolyzer | 0.6 | 2% | 2 | 25 |
| Battery (4h) | 0.15 | 3% | 0 | 15 |
| Hydrogen storage | 1000 EUR/MWh | 2% | 0 | 40 |
| Heat storage | 1000 EUR/MWh | 1% | 0 | 50 |
| Heat-only boiler | 0.08 | 2% | 1.5 | 40 |
| Heat pump | 0.6 | 2% | 2 | 25 |
| District Heating (dist only) | 1 | 2% | 0 | 50 |
| Import | – | – | 100 | – |
| Export | – | – | -25 | – |