
Bengt J. Olsson
LinkedIn: beos
X/Twitter: @bengtxyz
For the non-expert (like me…) the distinction between different types of power flows presented can be confusing. Typically in the Nordics we refer to NordPools “Auction Flows” map to visualize the power flows from the day-ahead (DA) market. From the DA market coupling calculations, two different flows may be presented
- Scheduled Exchanges
- Scheduled Physical Flows
NordPool presents the former, Scheduled Exchanges, as a map on its website, called “Auction Flows”. What is a scheduled exchange, and how does it differ from the physical flows?
In short “scheduled exchanges” provides a measure of the net exchange between two bidding zones. In principle this exchange is independent of the physical infrastructure. It is calculated from the known (after the DA market coupling results) net positions of each bidding zone. Instead of physical capacities, like ATC/NTC, only a “cost factor” is assigned to each border between two bidding zones. Then a cost optimization is performed to get a unique, “shortest path”, flow pattern between the bidding zones. This pattern does not include any physical properties of the network (except for HVDC links for which an ATC like capacity constraint is imposed). And hence no loop flows or similar flows, resulting from the physical properties of the network, are considered.
Scheduled Exchanges are important for the nomination and clearing of capacity exchanges between bidding zones, as a book-keeping measure between the TSOs and the clearing institutes. During the ATC/NTC era they where also used to calculate and distribute congestion revenues. However, with the introduction of the flow based capacity calculations, scheduled exchanges can not be used for this.
A better conceptual presentation of the planned flows are the Scheduled Physical Flows. These are also presented by NordPool, but not as a map, only as graphs listing the flows on each bidding zone border. These flows are calculated, also after DA clearing, from net positions and PTDF factors and hence takes into account physical aspects into the flows. This gives a different picture. Below is a comparison from the NordPool auction flow map and my scheduled physical flows map tool, for Thursday 2026-04-02 19:00 CEST.
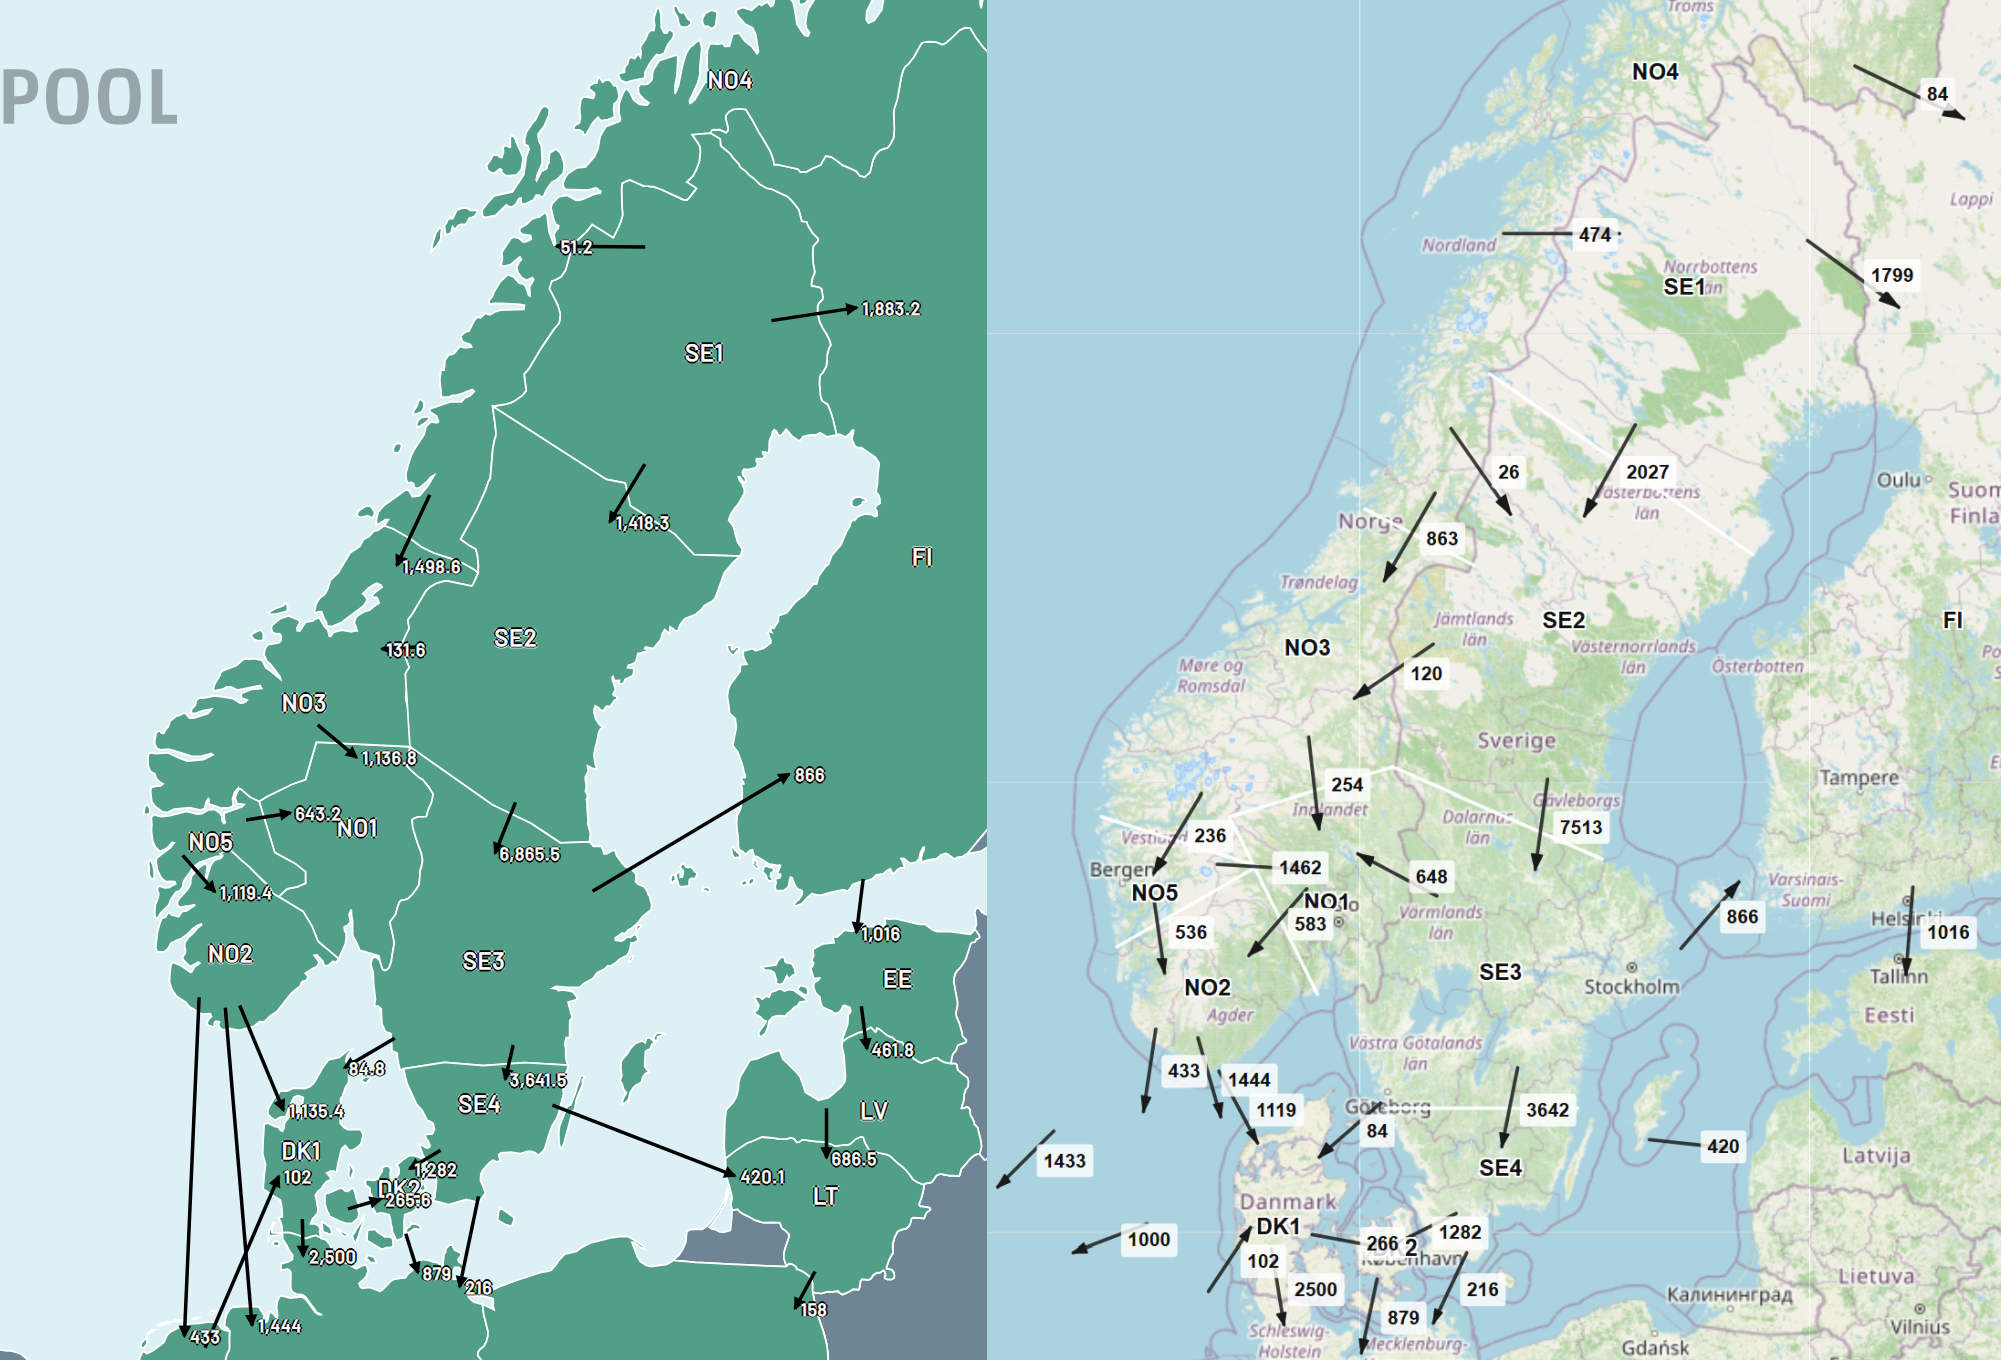
Most prominent is the difference between the Swedish/Norwegian flows. In NordPools map there is no flow from SE3 to NO1, while my map shows 648 MW. And a correspondingly lower flow over SE2->SE3 in the map of NordPool vs my map. It is clear that the North-South flow in Norway is limited and that part of this flows is transiting through Sweden.
Both maps are invariant with respect to net positions. For example, look at NO1:
- NP_sched_exchange(NO1) = -1136.8 -643.2 = -1780 MW (import)
- NP_sched_phy_flows(NO1) = -254 -648 -1462 + 583 = -1781 (import)
which is to be expected since both maps are based on calculations on net positions. For HVDC flows the power flow of the exporting end is used (importing may be lower due to losses). For the GB links, DA data is taken from ENTSO-E. SE3 – SE4 also includes the SouthWest Link (SWL).
PS: The tool has been updated to distinguish between three related physical flows:
- F0 flow which is the “inherent” flow between bidding zones when their net positions are zero. F0 is a physically driven “redistribution” of power flows between bidding zones that occurs even when there is no actively traded export or import between the zones.
- Scheduled Physical Flow: The resulting flows from the day-ahead market clearing. Hence the market driven physical flows over the border calculated as Σ_i NP_i * PTDF_bcnec,i where i runs over all bidding zones and bcnec is the Border CNEC in question.
- Forecasted Physical Flow: The total forecasted border flow, is equal to the Scheduled Physical Flow + F0 Flow.