
Bengt J. Olsson
X: @bengtxyz
LinkedIn: beos
In this post, we examine a sector-coupled model of a future European energy system.
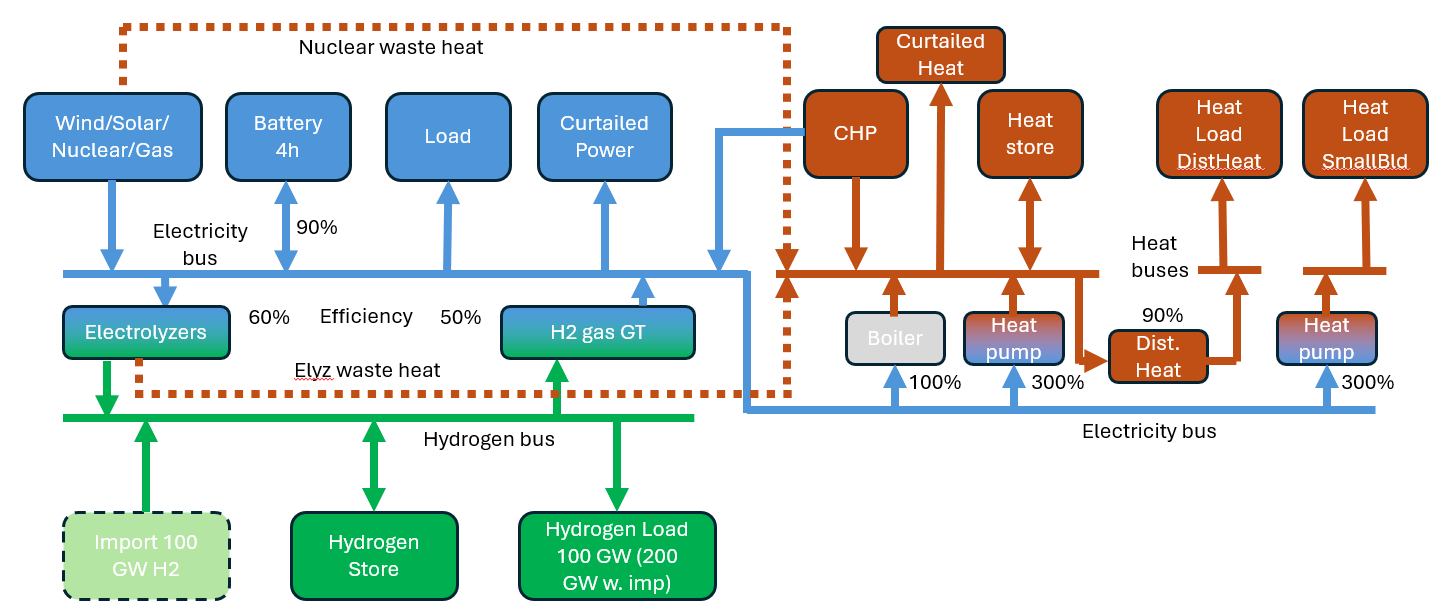
The model includes three major energy carriers: electricity, hydrogen, and heat. It is based on hourly data (17,544 hours) from the All-Europe dataset of EnergyCharts for 2023–2024.
The setup is a copper-plate model, meaning transmission constraints are ignored. This results in a “geographical averaging” of both generation and demand. In practice, this tends to favour renewable sources, which are more geographically dispersed and typically require more transmission (both in kilometres and capacity) compared to generation that can be located close to demand and offers higher capacity factors—such as nuclear power. On the other hand, the simplified economic model considering only overnight costs and not building time may be favorable for nuclear plants.
An important objective of this work is to examine how nuclear power costs influence energy dispatch. To this end, a series of simulations are conducted, varying only the CAPEX (overnight investment cost) parameter.
The geographical averaging also suppresses the need for flexibility, which can be seen in the relatively small sizes of especially hydrogen storages, but also possibly for heat storages.
Many exogenous assumptions are made, such as the lumping of a number of legacy power sources to a “fixed” dispatch, same as during 2023-2024, and the 10% excess heat withdrawal from electrolyzers and nuclear, as well as the fixed co-generation by CHPs, and others.
With these limitations in mind, hopefully this work can contribute somewhat to the general perspective regarding a future energy system for Europe.
Key findings
- Total generation: ~6,000 TWh/year (4,000 TWh electricity, 1,500 TWh electricity for hydrogen production, 400 TWh heating electricity for heat pumps)
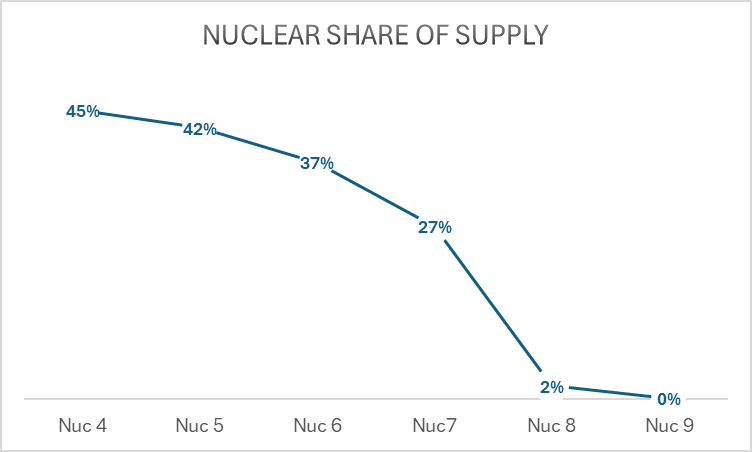
- The share of nuclear falls as its CAPEX rises; at 8-9 B€/GW no nuclear is built, resulting in a fully renewable system.
- Onshore wind always built to its cap (830 GW); offshore wind and solar increase as nuclear becomes more expensive.
- Storage needs: Hydrogen storage 34–44 TWh; heat storage 6–14 TWh; battery storage rises from zero (low-cost nuclear) to ~1.2 TWh (no nuclear). Note – Hydrogen storage size is very sensitive to cost assumption
- Curtailment ranges from 5 TWh to 267 TWh/year depending on scenario.
- CHP, hydrogen turbines, and gas turbines play larger roles in high-renewables, no-nuclear scenarios.
- Averaging effect: The aggregation inherent in the copper-plate model largely masks the need for flexibility, as reflected in the relatively small optimal hydrogen and heat storage capacities and the generally low curtailment levels.
Scope and Baseline
All-Europe—which includes the EU27 plus Great Britain, Norway, Switzerland, and several Eastern European countries—has an annual electricity consumption of about 2,750 TWh (EnergyCharts). This is ~10% higher than EU27 alone.
In the model, consumption is increased to 4,000 TWh, i.e. an additional 1,250 TWh. The increase represents:
- Electrification of transport
- Industrial conversion from fossil fuels to electricity
- Increased building cooling demand
- Data centres for AI and other digital infrastructure
- Other incremental loads
For simplicity, this additional demand is modelled as a fixed 143 GW load on top of the 2023–2024 measured load. To this consumption, power for hydrogen (flexible) is added, and also for building heating conversion, which introduces a strong seasonal variation.
Hydrogen Demand and Power-to-X
The Power-to-X sector is assumed to require a constant 100 GW of hydrogen supply (≈ 876 TWh LHV/year). Production is flexible, via electrolyzers, with hydrogen stored to maintain a steady 100 GW output. Note that the import of 100 GW of hydrogen shown in the figure above is not part of this model or simulation.
Building Heating Conversion
Today, building heating relies on both electricity and fossil fuels (mainly natural gas, but also oil). In this model, building heat refers only to the share currently supplied by fossil fuels. Existing electric heating is already included in the general electricity demand and is therefore excluded from the heat demand figures.
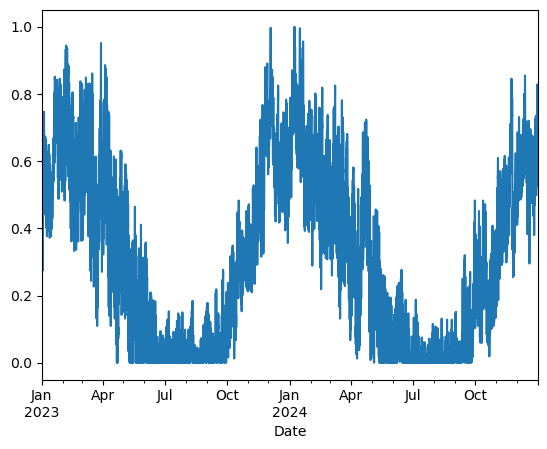
Current fossil-fuel-based building heating demand — about 1,500 TWh (thermal) — is assumed to be fully decarbonized, primarily through heat pumps and district heating:
- 40% via district heating, supplied by large-scale heat pumps and supplemented by waste heat from electrolyzers and nuclear plants.
- 60% via individual, smaller heat pumps.
Thermal flexibility is provided by large-scale hot water pit storage. Biomass-fuelled CHP plants with fixed power-to-heat ratios contribute to both electricity and heat supply.
Dispatch assumptions
All fossil-fuel-based generation is removed, except for gas turbines, which act as peakers and face very high ETS CO₂ costs.
Wind and solar generation is scaled from their 2023–2024 values and adjusted according to the modelling assumptions.
- Onshore wind capacity is limited to 4× current levels (~830 GW in the model).
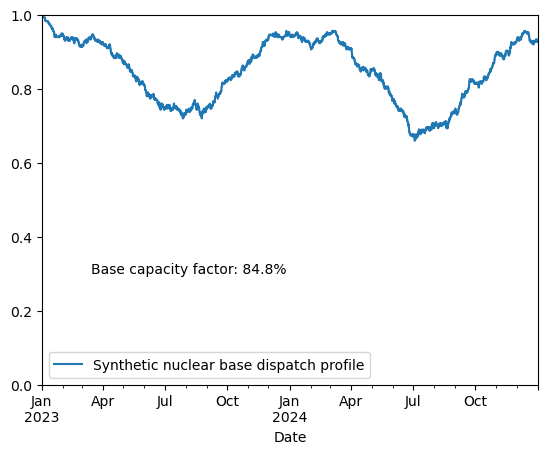
Nuclear uses a synthetic dispatch profile similar to today’s, with most maintenance and outages in the summer half of the year.
- Capacity factor: 85% nominal, but somewhat lower in practice due to limited load-following capability.
- Nuclear can ramp down to 60% of capacity, at a maximum rate of 1/6 of unit capacity per hour.
“Fixed” sources retain their 2023–2024 dispatch patterns from EnergyCharts. These include hydro (run-of-river, reservoir, pumped), geothermal, biomass, waste, other renewables, and net imports/exports.
- These are kept constant because the overall load shape in the 2050 simulation is assumed to be similar, making it likely they would follow comparable dispatch patterns.
Key Modelling Assumptions
General
- Copper-plate model: No transmission constraints or costs
- All fossil generation removed except gas (see below)
- Baseline generation from All-Europe EnergyCharts 2023–2024, with modifications below
- Costs according to table In Appendix below
Generation Assumptions
- Solar PV: 2023 generation scaled by 1.2× to match 2024 installed capacity.
- Onshore wind: Rescaled to improve capacity factor from ~23% to 30%. Installed capacity is capped at 4× the current level (~830 GW). No other limits are imposed.
- Installed capacity calculation: For onshore wind and solar, set as peak delivered power ÷ 0.6 (based on inspection of EnergyCharts data).
- Nuclear: Synthetic generation profile with summer minima and an 85% capacity factor. Output can ramp down at a rate of 1/6 of unit capacity per hour, but not below 60% of installed capacity—allowing limited load-following capability.
- “Fixed” sources: Hydro, geothermal, biomass, waste, and net imports/exports are kept at 2023–2024 dispatch levels. These are assumed to have similar patterns in 2050, with a variable cost of 45 €/MWh and fully depreciated.
- CHP: Biomass-fuelled combined heat and power plants with fixed efficiencies of 50% heat and 35% electricity.
- Resistive boilers: Eliminated from district heating supply, as they are out-competed by heat pumps despite their low cost.
- Gas generation: Retained as a last-resort option, with high variable costs reflecting high ETS CO₂ prices, competing with hydrogen turbines.
- Electrolyzers & nuclear: Each contributes 10% of consumed/generated electrical power to the district heating network.
Consumption Assumptions
- Electricity: The baseline is the 2023–2024 hourly consumption profile, with an additional fixed 143 GWh/h added to represent electrification and other new loads.
- Hydrogen: Assumed constant consumption of 100 GW (≈ 876 TWh/year, H₂ LHV). Additional hydrogen imports could occur in reality, but are not considered in this model.
- Heat: Total heat demand is assumed equal to today’s, but with 1,500 TWh thermal currently supplied by gas and oil fully replaced by heat pumps and district heating. Of this converted heat demand:
- 40% is supplied via district heating (fed by large-scale heat pumps and other sources)
- 60% is supplied directly by individual heat pumps
Storage (optimised capacity)
- Batteries: 4-hour duration, 90% round-trip efficiency
- Hydrogen storage: Salt caverns
- Heat storage: Hot-water pits
Modelling/Simulation
- Snapshot build—no investment time dynamics, all assets (except “Fixed”) assumed new
- Discount rate: 5%
- Implemented in PyPSA with the HiGHS solver
- Runtime: ~90 minutes on a 12th-gen Core i9, 32 GB RAM
Results
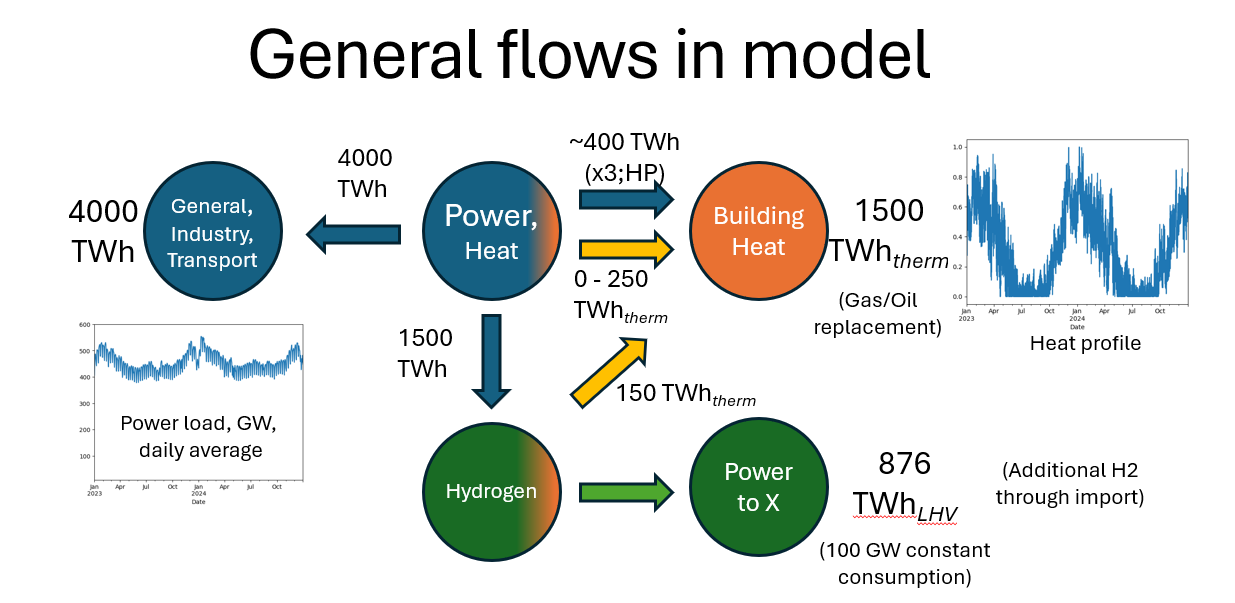
Resulting Flows in the Model
The demand figures of 4,000 TWh (electric end usage), 1,500 TWh (thermal heat), and ~876 TWh (hydrogen LHV) are exogenous parameters — provided as fixed inputs to the model.
The power system generates approximately 6,000 TWh in total, distributed as follows:
- 4,000 TWh to meet electric end-user demand.
- 1,500 TWh for hydrogen production.
- 400 TWh for converting gas/oil-based heating via district heating or heat pumps alone.
For heat pumps, a coefficient of performance (COP) of 3 is assumed. Roughly 150 out of the 1500 TWh for heating comes from excess heat produced by electrolyzers (10% of input power), and another 0-250 TWh from nuclear heat (10% of produced power from nuclear), depending on the amount of nuclear dispatch in the model. This leaves 1,100 – 1,350 TWh for heating by heat pumps and CHP plants. A majority of this heat comes from heat pumps with a COP of 3, making the electrical load much lower, on the order of 400 TWh (which multiplied by 3 gives 1,200 TWh thermal).
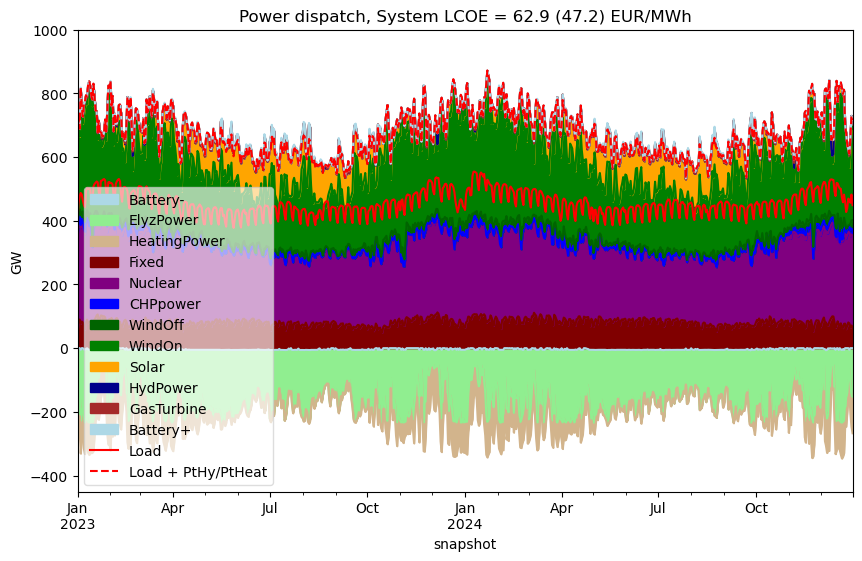
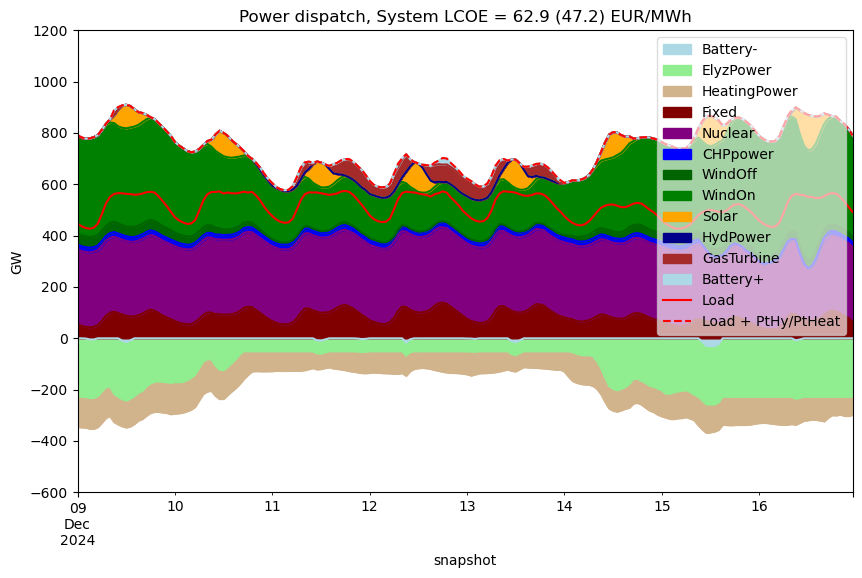
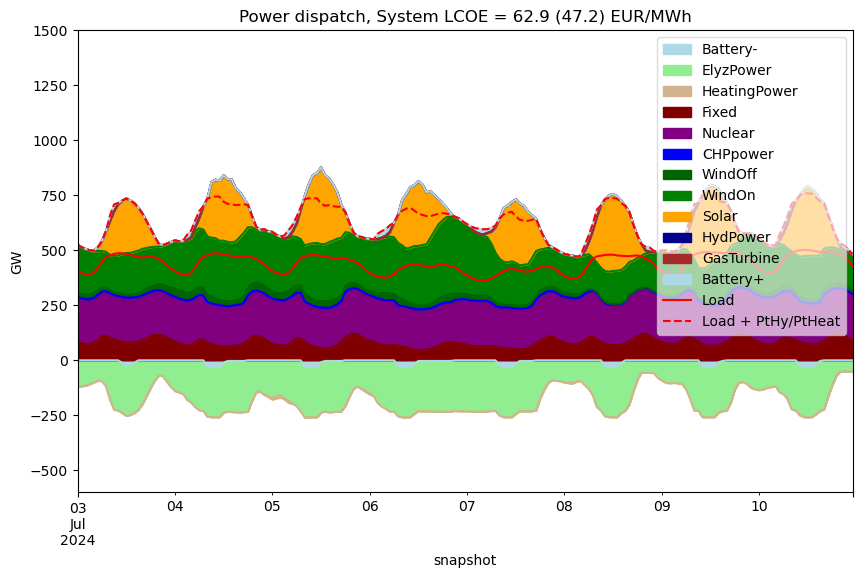
Energy supply and installed capacity
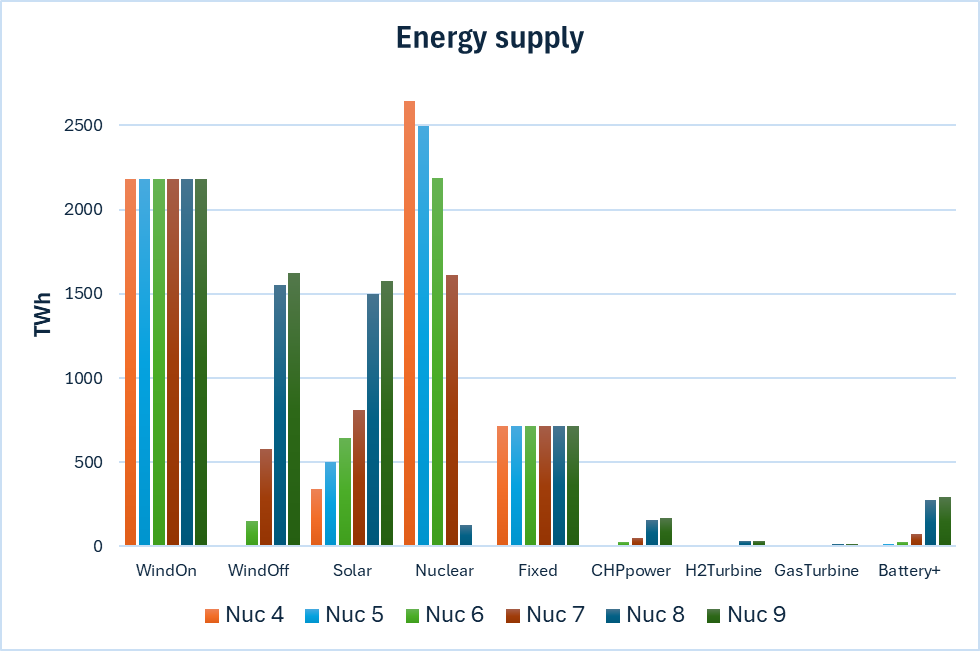
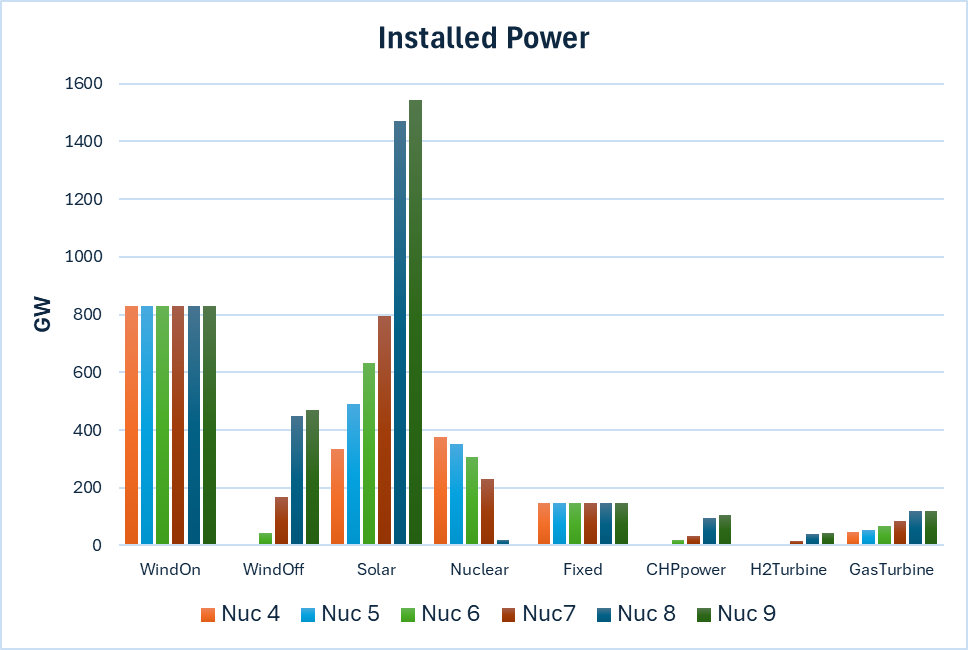
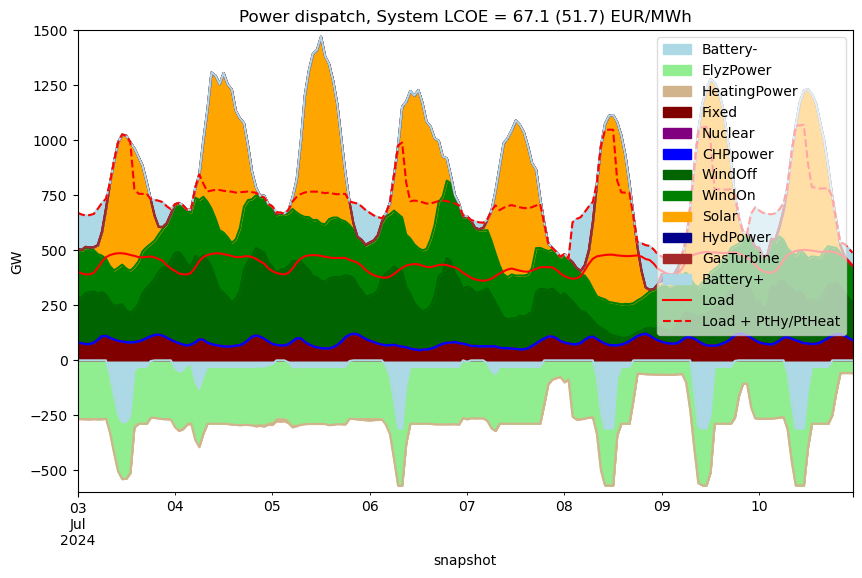
The type and quantity of installed and dispatched generation are, as expected, highly sensitive to the assumed cost of nuclear power. In the scenarios above, overnight capital costs of 4, 5, 6, 7, 8, and 9 billion EUR/GW are examined. At 9 B EUR/GW, no nuclear capacity is built, resulting in a fully renewable, no-nuclear scenario. The “Nuc 8” case is effectively also a fully renewable system.
In all scenarios, onshore wind is developed to its limit of roughly 830 GW—about four times the present installed capacity. As nuclear costs rise, lost nuclear generation is replaced primarily by offshore wind and, to a lesser extent, by solar PV.
Hydrogen and gas turbines act as “peakers,” supplying relatively small amounts of energy compared to their installed capacity. The highest capacity factors for these peakers occur in the no-nuclear, fully renewable scenario—9% for hydrogen turbines and 1.6% for gas turbines.
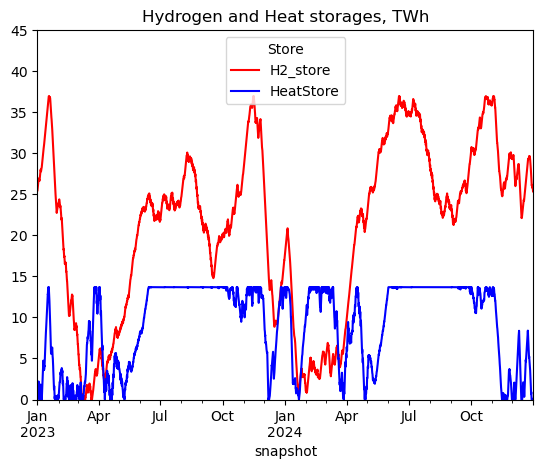
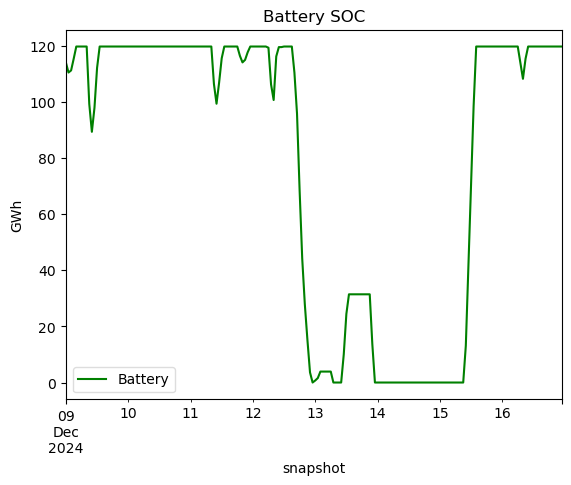
Storage and flexibility
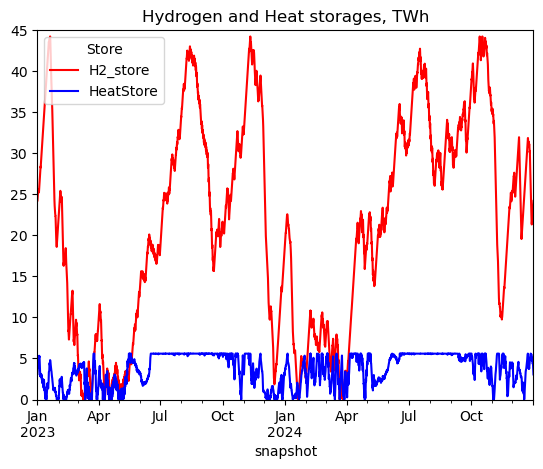
The model produces relatively small optimal hydrogen and heat storage capacities, likely reflecting the averaging effect of the all-Europe, copper-plate assumption.
- Hydrogen storage: 34–54 TWh, smallest in the low-cost nuclear scenario and largest in the no-nuclear scenario
- Heat storage: 6–14 TWh, smallest in the no-nuclear scenario
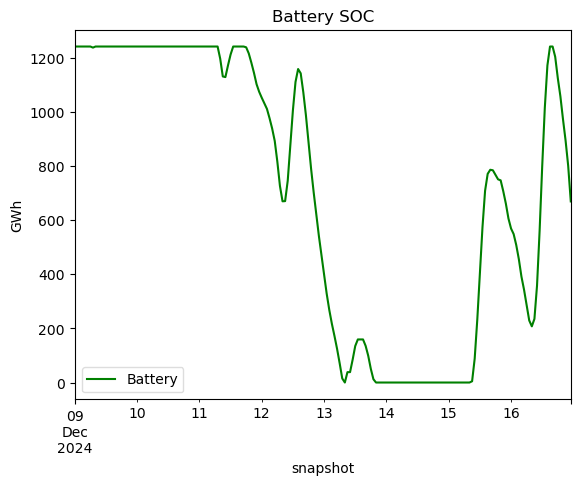
Battery capacity shows a strong inverse correlation with the amount of nuclear power:
- 0 GWh in the lowest-cost nuclear scenario
- Up to 1,240 GWh in the fully renewable, no-nuclear scenario
Other sources of flexibility follow a similar trend:
- CHP electricity generation: 0–172 TWh (low-cost nuclear → no-nuclear)
- Hydrogen turbine generation: 0–34 TWh
- Gas turbine generation: 0–17 TWh
Curtailment ranges from 5 TWh in the low-cost nuclear case to 267 TWh in the no-nuclear scenario.
Addendum – Storage Cost Sensitivity
The optimal storage capacity appears to be quite sensitive to assumed storage costs.
A sensitivity run was performed using a CAPEX of 500 EUR/MWh for hydrogen storage, instead of the 2,000 EUR/MWh used in the base case.
In the fully renewable scenario, this reduction in cost increased optimal hydrogen storage capacity from 44 TWh to 254 TWh, and increasing solar dispatch at the cost of lower offshore wind dispatch. For the Nuc 6 scenario the change was smaller, from 37 to 78 TWh, without significantly altering the overall power generation mix for that scenario.
Comparison of 6 BEUR/MW and No-nuclear/Renewable scenarios
Nuclear @ 6 BEUR/MW
6 B€/GW nuclear scenario: Balanced mix of nuclear and renewables, small curtailment, minimal battery use (~120 GWh).
Note that with a lower CAPEX cost of storage the sizes grow significantly, see the sensitivity analysis.
Bus balances and loads for the renewables + nuclear scenario
CAPEX nuclear: 6 BEUR/MW
Renewables + Nuclear
scenario
Power bus (TWh electricity)
===========================
WindOn            2184.3
WindOff            151.2
Solar              645.7
Nuclear           2185.3
Fixed              714.6
CHPpower            29.2
HydPower             0.0
GasTurbine           3.1
Battery+            28.4
Battery-           -32.4
ElyzPower        -1465.1
PowerToLargeHP    -115.0
PowerToHeat          0.0
PowerToSmallHP    -300.0
Load             -3998.6
Curtailed          -30.7
dtype: float64
Balance power bus     :  0.0

Hydrogen bus (TWh H2 LHV)
=========================
H2fromElyz     879.0
H2toCCGT         0.0
H2toPowX      -877.2
H2FromStore    148.4
H2ToStore     -150.2
dtype: float64
Balance hydrogen bus  : -0.0
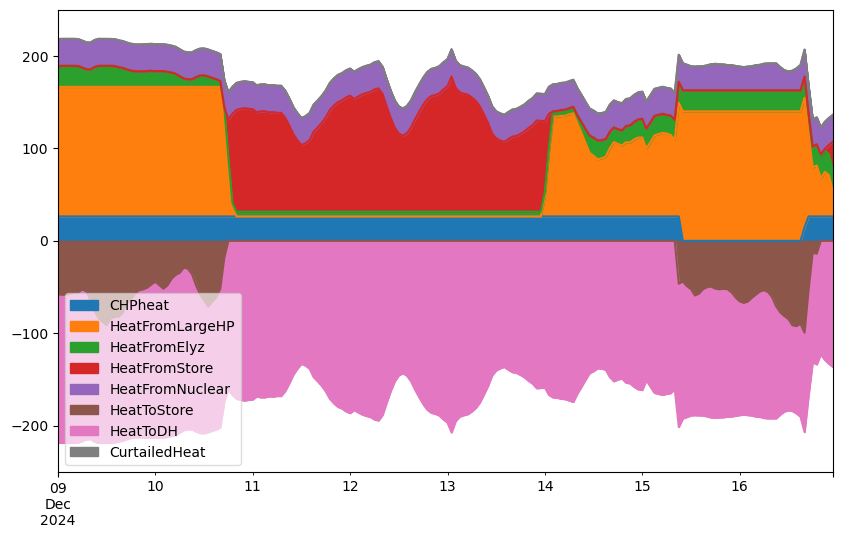
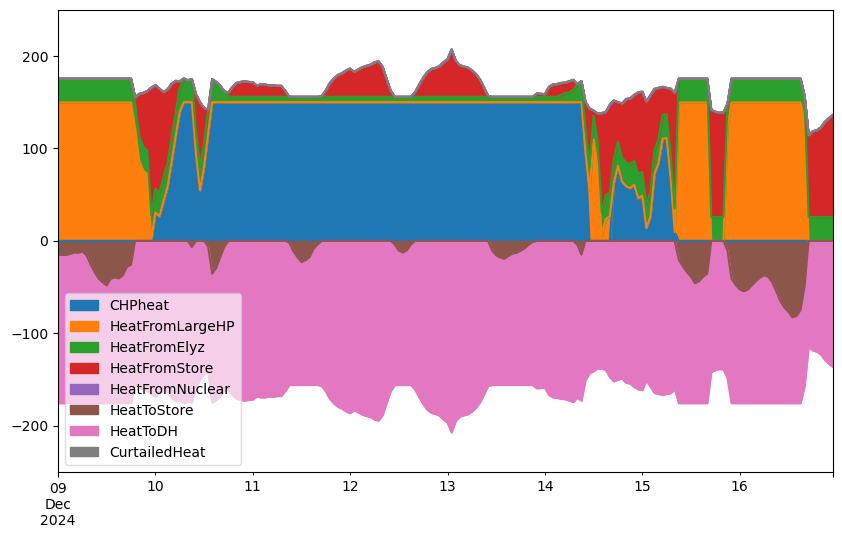
Heat store bus (TWh heat)
=========================
CHPheat             41.7
HeatFromElyz       146.5
HeatFromCCGT         0.0
HeatFromNuclear    218.5
HeatFromLargeHP    345.0
HeatFromBoiler       0.0
HeatFromStore      152.2
HeatToStore       -160.3
HeatToDH          -666.7
CurtailedHeat      -76.9
dtype: float64
Balance heat store bus:  0.0

Loads (TWh power/H2_LHV/heat)
========================
Power loads  5878.7
Hydrogen      877.2
HeatLoadDH    600.0
HeatLoad      900.0
No-nuclear, fully renewable
No-nuclear scenario: Fully renewable, larger battery capacity (~1.2 TWh), higher curtailment, and more reliance on CHP and peakers.
Note that with a lower CAPEX cost of storage the sizes grow significantly, see the sensitivity analysis.
Bus balances and loads for the renewables only scenario
CAPEX nuclear: 9 BEUR/MW
Renewables only
scenario
Power bus (TWh electricity)
===========================
WindOn            2184.3
WindOff           1621.6
Solar             1575.1
Nuclear              0.0
Fixed              714.6
CHPpower           171.5
HydPower            33.8
GasTurbine          16.7
Battery+           294.3
Battery-          -363.2
ElyzPower        -1577.8
PowerToLargeHP    -105.6
PowerToHeat          0.0
PowerToSmallHP    -300.0
Load             -3998.6
Curtailed         -266.8
dtype: float64
Balance power bus     : -0.0

Hydrogen bus (TWh H2 LHV)
=========================
H2fromElyz     946.7
H2toCCGT       -67.6
H2toPowX      -877.2
H2FromStore    269.7
H2ToStore     -271.6
dtype: float64
Balance hydrogen bus  : -0.0
Heat store bus (TWh heat)
=========================
CHPheat            245.1
HeatFromElyz       157.8
HeatFromCCGT         0.0
HeatFromNuclear      0.0
HeatFromLargeHP    316.7
HeatFromBoiler       0.0
HeatFromStore      159.3
HeatToStore       -162.6
HeatToDH          -666.7
CurtailedHeat      -49.6
dtype: float64
Balance heat store bus: -0.0

Loads (TWh power/H2_LHV/heat)
========================
Power loads  5982.0
Hydrogen      877.2
HeatLoadDH    600.0
HeatLoad      900.0
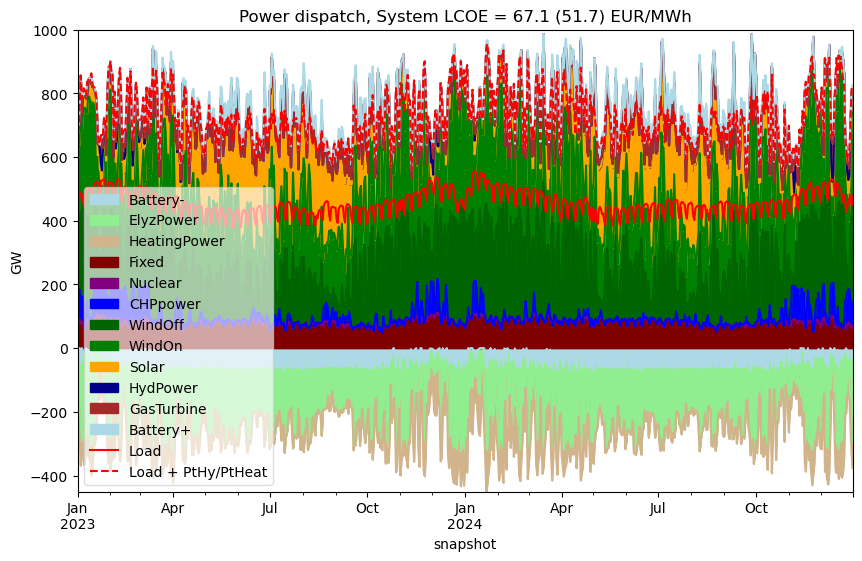
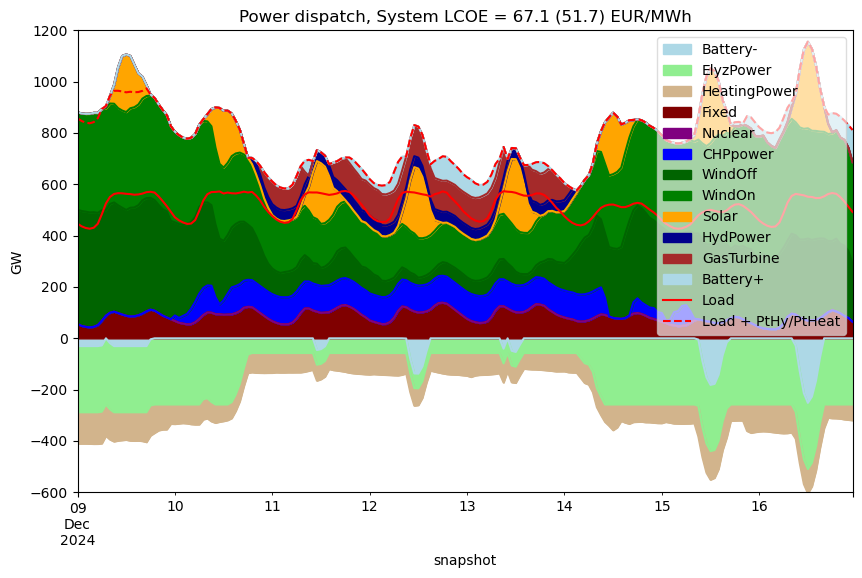
The cost numbers given above the graphs are
- System LCOE for meeting the electrical load only (excluding electricity for hydrogen and heat production)
- Within parantheses: System LCOE for meeting all energy demand (energy above + value weighted hydrogen and heat demand)
As absolute values these are unreliable since the model is not a build-out model, but rather a “snap-shot” model with everything (except “Fixed” power sources) are built overnight. But the relative difference may be interesting. The value-weighted hydrogen and heat demand uses the shadow prices on the hydrogen and heat buses relative to the electricity bus as weights. That is, hydrogen energy demand has a higher weight than electricity and the opposite for heat demand.
Sensitivity Analysis
By altering key parameters and comparing the resulting outputs, it is possible to assess the robustness of the model results. The following variations are based on the “Nuc 6” base scenario.
Discount Rate
In the base case, the discount rate is 5%. Increasing it to 7% raises the system LCOE by approximately 17%. The generation mix remains broadly similar, although the share of nuclear generation decreases slightly—from 37% to 35%.
Gas + CCS
In the base case, gas peakers have a very high VOM of 267 EUR/MWh, reflecting an assumed ETS cost of 200 EUR per MWh of gas-generated electricity. If we increase the CAPEX of a gas plant by 50% to add CCS—assuming 90% CO₂ removal—the VOM falls to 72.5 EUR/MWh.
This change increases gas generation from 3 TWh to 48 TWh. While significant in relative terms, the overall production mix is largely unaffected.
Also since CO₂ is decreased to a tenth per produced MWh, the number of produced MWh increases by a factor of 16. That is, the absolute CO2 emissions increase with Gas + CCS.
Hydrogen Storage Cost
The base-case hydrogen storage CAPEX is 2,000 EUR/MWh. Lower cost estimates exist; if the cost is reduced to 500 EUR/MWh, optimal storage capacity more than doubles—from 37 TWh to 78 TWh— again without materially changing the generation mix.
- However, in the fully renewable scenario, this change had a much higher effect: The hydrogen storage size changed from 44 to 254 TWh, followed by a significant increase in solar power dispatch at the cost of lower offshore wind dispatch.
Conclusions
This simplified sector-coupled model is not a prediction, but a tool to understand how cost assumptions, especially for nuclear, shape the European energy mix in 2050.
It highlights the trade-offs between nuclear and renewables, storage requirements, and the role of hydrogen and district heating in a decarbonised system.
However, the copper-plate assumption (i.e., no transmission restrictions) averages both production and consumption in a way that masks the true need for system flexibility. This is reflected in the relatively low optimal capacities for hydrogen and heat storage.
Despite this, the model still favours a surprisingly high share of nuclear power. The results remain relatively robust to changes in key parameters—such as the discount rate—or to substituting conventional gas peakers with gas-plus-CCS peakers, which face much lower CO₂ ETS costs.
Appendices
Appendix 1: Data from all simulations
CAPEX nuclear: 4 BEUR/MW

Power bus (TWh electricity)
===========================
WindOn            2184.3
WindOff              0.0
Solar              340.1
Nuclear           2647.9
Fixed              714.6
CHPpower             0.0
HydPower             0.0
GasTurbine           0.7
Battery+             0.0
Battery-             0.0
ElyzPower        -1465.6
PowerToLargeHP    -118.7
PowerToHeat          0.0
PowerToSmallHP    -300.0
Load             -3998.6
Curtailed           -4.7
dtype: float64
Balance power bus     :  0.0

Hydrogen bus (TWh H2 LHV)
=========================
H2fromElyz     879.4
H2toCCGT         0.0
H2toPowX      -877.2
H2FromStore    110.2
H2ToStore     -112.3
dtype: float64
Balance hydrogen bus  :  0.0

Heat store bus (TWh heat)
=========================
CHPheat              0.0
HeatFromElyz       146.6
HeatFromCCGT         0.0
HeatFromNuclear    264.8
HeatFromLargeHP    356.0
HeatFromBoiler       0.0
HeatFromStore      105.7
HeatToStore       -110.9
HeatToDH          -666.7
CurtailedHeat      -95.5
dtype: float64
Balance heat store bus:  0.0

Loads (TWh power/H2_LHV/heat)
========================
Power loads  5882.9
Hydrogen      877.2
HeatLoadDH    600.0
HeatLoad      900.0
CAPEX nuclear: 5 BEUR/MW

Power bus (TWh electricity)
===========================
WindOn            2184.3
WindOff              0.0
Solar              499.7
Nuclear           2499.7
Fixed              714.6
CHPpower             2.2
HydPower             0.0
GasTurbine           1.6
Battery+            15.7
Battery-           -17.8
ElyzPower        -1466.8
PowerToLargeHP    -120.5
PowerToHeat          0.0
PowerToSmallHP    -300.0
Load             -3998.6
Curtailed          -14.1
dtype: float64
Balance power bus     :  0.0

Hydrogen bus (TWh H2 LHV)
=========================
H2fromElyz     880.1
H2toCCGT         0.0
H2toPowX      -877.2
H2FromStore    125.1
H2ToStore     -128.0
dtype: float64
Balance hydrogen bus  :  0.0

Heat store bus (TWh heat)
=========================
CHPheat              3.1
HeatFromElyz       146.7
HeatFromCCGT         0.0
HeatFromNuclear    250.0
HeatFromLargeHP    361.5
HeatFromBoiler       0.0
HeatFromStore      141.6
HeatToStore       -148.8
HeatToDH          -666.7
CurtailedHeat      -87.4
dtype: float64
Balance heat store bus: -0.0

Loads (TWh power/H2_LHV/heat)
========================
Power loads  5885.9
Hydrogen      877.2
HeatLoadDH    600.0
HeatLoad      900.0
CAPEX nuclear: 6 BEUR/MW

Power bus (TWh electricity)
===========================
WindOn            2184.3
WindOff            151.2
Solar              645.7
Nuclear           2185.3
Fixed              714.6
CHPpower            29.2
HydPower             0.0
GasTurbine           3.1
Battery+            28.4
Battery-           -32.4
ElyzPower        -1465.1
PowerToLargeHP    -115.0
PowerToHeat          0.0
PowerToSmallHP    -300.0
Load             -3998.6
Curtailed          -30.7
dtype: float64
Balance power bus     :  0.0

Hydrogen bus (TWh H2 LHV)
=========================
H2fromElyz     879.0
H2toCCGT         0.0
H2toPowX      -877.2
H2FromStore    148.4
H2ToStore     -150.2
dtype: float64
Balance hydrogen bus  : -0.0

Heat store bus (TWh heat)
=========================
CHPheat             41.7
HeatFromElyz       146.5
HeatFromCCGT         0.0
HeatFromNuclear    218.5
HeatFromLargeHP    345.0
HeatFromBoiler       0.0
HeatFromStore      152.2
HeatToStore       -160.3
HeatToDH          -666.7
CurtailedHeat      -76.9
dtype: float64
Balance heat store bus:  0.0

Loads (TWh power/H2_LHV/heat)
========================
Power loads  5878.7
Hydrogen      877.2
HeatLoadDH    600.0
HeatLoad      900.0
CAPEX nuclear: 7 BEUR/MW

Power bus (TWh electricity)
===========================
WindOn            2184.3
WindOff            580.7
Solar              812.7
Nuclear           1610.7
Fixed              714.6
CHPpower            52.1
HydPower             5.3
GasTurbine           7.9
Battery+            73.4
Battery-           -85.0
ElyzPower        -1482.6
PowerToLargeHP    -118.3
PowerToHeat          0.0
PowerToSmallHP    -300.0
Load             -3998.6
Curtailed          -57.3
dtype: float64
Balance power bus     :  0.0

Hydrogen bus (TWh H2 LHV)
=========================
H2fromElyz     889.6
H2toCCGT       -10.6
H2toPowX      -877.2
H2FromStore    183.9
H2ToStore     -185.6
dtype: float64
Balance hydrogen bus  :  0.0

Heat store bus (TWh heat)
=========================
CHPheat             74.5
HeatFromElyz       148.3
HeatFromCCGT         0.0
HeatFromNuclear    161.1
HeatFromLargeHP    355.0
HeatFromBoiler       0.0
HeatFromStore      172.4
HeatToStore       -178.5
HeatToDH          -666.7
CurtailedHeat      -66.1
dtype: float64
Balance heat store bus: -0.0

Loads (TWh power/H2_LHV/heat)
========================
Power loads  5899.5
Hydrogen      877.2
HeatLoadDH    600.0
HeatLoad      900.0
CAPEX nuclear: 8 BEUR/MW

Power bus (TWh electricity)
===========================
WindOn            2184.3
WindOff           1551.0
Solar             1501.1
Nuclear            125.5
Fixed              714.6
CHPpower           157.6
HydPower            31.6
GasTurbine          17.0
Battery+           276.4
Battery-          -339.4
ElyzPower        -1570.5
PowerToLargeHP    -108.2
PowerToHeat          0.0
PowerToSmallHP    -300.0
Load             -3998.6
Curtailed         -242.3
dtype: float64
Balance power bus     :  0.0

Hydrogen bus (TWh H2 LHV)
=========================
H2fromElyz     942.3
H2toCCGT       -63.2
H2toPowX      -877.2
H2FromStore    264.4
H2ToStore     -266.3
dtype: float64
Balance hydrogen bus  :  0.0

Heat store bus (TWh heat)
=========================
CHPheat            225.1
HeatFromElyz       157.1
HeatFromCCGT         0.0
HeatFromNuclear     12.5
HeatFromLargeHP    324.6
HeatFromBoiler       0.0
HeatFromStore      164.4
HeatToStore       -168.2
HeatToDH          -666.7
CurtailedHeat      -48.8
dtype: float64
Balance heat store bus: -0.0

Loads (TWh power/H2_LHV/heat)
========================
Power loads  5977.3
Hydrogen      877.2
HeatLoadDH    600.0
HeatLoad      900.0
CAPEX nuclear: 9 BEUR/MW

Power bus (TWh electricity)
===========================
WindOn            2184.3
WindOff           1621.6
Solar             1575.1
Nuclear              0.0
Fixed              714.6
CHPpower           171.5
HydPower            33.8
GasTurbine          16.7
Battery+           294.3
Battery-          -363.2
ElyzPower        -1577.8
PowerToLargeHP    -105.6
PowerToHeat          0.0
PowerToSmallHP    -300.0
Load             -3998.6
Curtailed         -266.8
dtype: float64
Balance power bus     : -0.0

Hydrogen bus (TWh H2 LHV)
=========================
H2fromElyz     946.7
H2toCCGT       -67.6
H2toPowX      -877.2
H2FromStore    269.7
H2ToStore     -271.6
dtype: float64
Balance hydrogen bus  : -0.0

Heat store bus (TWh heat)
=========================
CHPheat            245.1
HeatFromElyz       157.8
HeatFromCCGT         0.0
HeatFromNuclear      0.0
HeatFromLargeHP    316.7
HeatFromBoiler       0.0
HeatFromStore      159.3
HeatToStore       -162.6
HeatToDH          -666.7
CurtailedHeat      -49.6
dtype: float64
Balance heat store bus: -0.0

Loads (TWh power/H2_LHV/heat)
========================
Power loads  5982.0
Hydrogen      877.2
HeatLoadDH    600.0
HeatLoad      900.0
Appendix 2: Cost assumptions
| Asset | Overnight cost (MEUR/MW) | FOM (% of OC) | VOM (EUR/MWh) | Lifetime |
|---|---|---|---|---|
| Solar | 0.33 | 3% | 0.5 | 25 |
| Wind – Onshore | 1.1 | 2% | 1 | 25 |
| Wind – Offshore | 2.2 | 2% | 2 | 25 |
| Gas turbine (H2/NG) | 1 | 2% | H2: 4 NG: 269.17 | 25 |
| Nuclear | 4, 6, 7, 9 | 2% | 10 | 60 |
| Combined heat/power | 1 (per MW fuel) | 3% | 32.5 (per MWh fuel) | 40 |
| Electrolyzer | 0.6 | 2% | 2 | 25 |
| Battery (4h) | 0.15 | 3% | 0 | 15 |
| Hydrogen storage | 2000 EUR/MWh | 2% | 0 | 40 |
| Heat storage | 1500 EUR/MWh | 1% | 0 | 50 |
| Heat pump | 0.6 | 2% | 2 | 25 |
| District Heating (dist only) | 1 | 2% | 0 | 50 |