
Bengt J. Olsson
LinkedIn: beos
X/Twitter: @bengtxyz
The division of Sweden into four different bidding zones raises a lot of controversy domestically. This is understandable since prices are strongly differentiated between an expensive south part of the country and a very cheap north. Very often the price differences boil down to the unofficial “Cut 3” within the SE3 bidding zone. It is formally called the “Svk_Snitt_3(ÖST>VÄST)” CNE (Critical Network Element), that is the “East -> West” Cut within SE3. In this situation, a strong counter-intuitive flow from expensive SE3 to very cheap FI over the Fenno-Skan link is often observed.
I have previously, about a year ago, explained the price differences between SE2/3/4 in flow-based terms, using PTDF factors of the involved bidding zones on the Cut 3 CNE. This more detailed investigation, which also includes a simple simulation model of the three bidding zones can be found here (in Swedish).
In this post I will generalize a view of the Nordic system, in a way that demystifies much of what is going on.
Assumptions
- The ‘Cut 3’ constraint dominates the Nordic power system. Since I started recording a couple of months ago, it has been binding more than 50% of the time, with ten times the impact on congestion income of the next-largest constraint.
- The PTDF factors of the bidding zones (for Cut 3) provide a measure of “electrical equalness”
PTDF factors
The PTDF factors describe how much a “net injection” in a bidding zone affects the flow through the constraint in question. For example if the PTDF coefficient for SE2 would be 0.9 for Cut 3, it means that 1 MW more production in SE2 would lead to a 0.9 MW load on Cut 3, everything else equal. In a sense this makes the PTDF factors a measure of “electrical equalness”. If two bidding zones have about the same PTDF, it doesn’t really matter which zone increases its net injection, both will have the same effect on the constrained flow through the CNE. It will be their combined injection, or net position, that affects the constraint.
Here is a list of the PTDF factors for Cut 3 this morning (2026-07-16 08:00 CEST):
| Bidding zone | PTDF |
|---|---|
| DK1 | 0,00000 |
| DK2 | −0,00006 |
| FI | 0,94054 |
| NO1 | 0,14283 |
| NO2 | 0,10109 |
| NO3 | 0,70775 |
| NO4 | 0,86971 |
| NO5 | 0,19370 |
| SE1 | 0,93872 |
| SE2 | 0,95504 |
| SE3 | 0,41537 |
| SE3_FS* | 0,96199 |
| SE4 | −0,00315 |
Electrical partitioning of the Nordic system
Looking at the PTDF factors we can see the following patterns:
- Close to 1: FI, SE1, SE2, NO4, SE3_FS
- Close to 0: DK, SE4, NO1, NO2, NO5
- In-between: SE3 (0.4), NO3 (0.7)
The PTDF factors indicate a division of the Nordic system into
- a north-eastern block, comprising FI, SE1, SE2, NO4, the north-east of SE3 and most of NO3, and
- a south-west block, comprising DK, SE4, the south-west of SE3, NO1, NO2, NO5 and part of NO3
Now let’s look at the map under this assumption
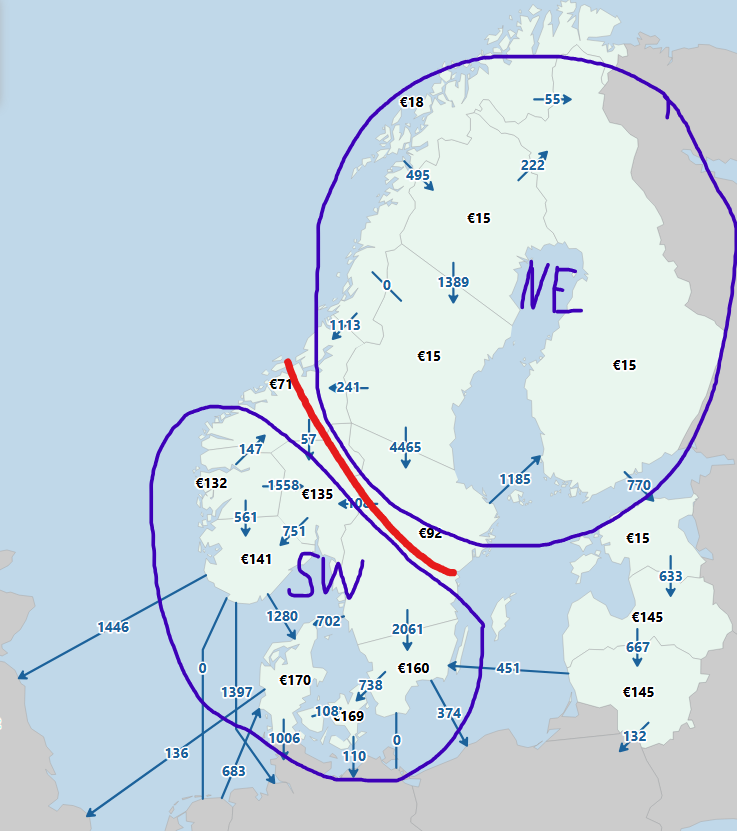
Already in this simplified view of two Nordic zones we can see the low cost north-east (~15 €/MWh) and the expensive south-west (~150 €/MWh), and NO3/SE3 with intermediate prices, quite well reflecting their intermediate PTDF factors. The price difference between the NE and SW areas matches quite well the shadow price of the Cut 3 constraint, which is 143 €/MWh for this particular hour.
In this view, the counter-intuitive flow from SE3 towards FI is not that strange either. It evens out the production vs consumption inside the common NE bidding zone. This view is reinforced by the SE3-FS (Fenno-Skan landing point) PTDF factor. It has a nodal “NE” PTDF factor of 0.96, showing that while situated within SE3 its “electrical belonging” is within the NE block (as does the whole area of SE3 north-east of the red bottleneck border).
The nodal price of the SE3_FS can be calculated from its PTDF (here using the price difference tool):

The nodal price in SE3_FS is thus 13.2 EU, which is ~2 €/MWh less than in Finland. From this point of view the flow over Fenno-Skan is not even counter-intuitive, it flows from an area with lower nodal price to the higher priced Finland.
In fact in this view it does not really matter if the flow from Sweden enters via northern Finland (Aurora) or through the Fenno-Skan link, both are used to internally balance the large NE zone.
This provides a simple but yet reasonably accurate view of both the price differences and the Fenno-Skan non-intuitive flow. When Cut 3 is binding (and is the dominating constraint), two imaginary Nordic zones emerge, divided by the cut. Within these two imaginary zones, prices are roughly the same, and flows such as the Fenno-Skan are internal and thus not associated with “intuitiveness”. They just make sure the zone is balanced.