
Bengt J. Olsson
X: @bengtxyz
LinkedIn: beos
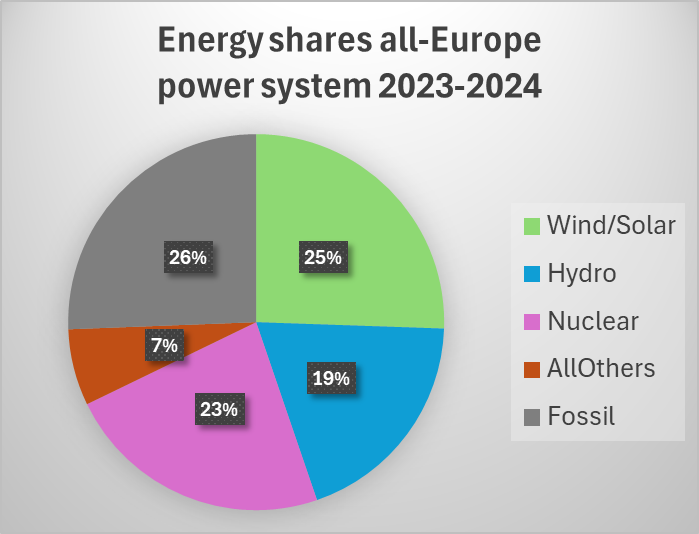
Thanks to the excellent data service provided by EnergyCharts, we can explore how the all-European power system was balanced in 2023–2024 to ensure supply met demand.
🌍Power Dispatch in all-Europe 2023–2024
The following chart shows the aggregated European power dispatch, based on EnergyCharts data. To reduce clutter from day-to-day and weekend variation, weekly averages of both load and supply are shown.
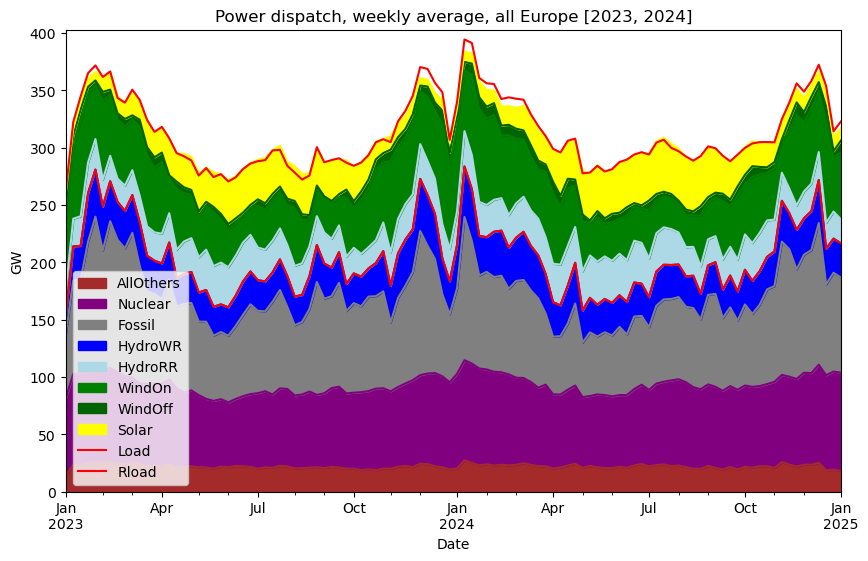
The two red curves in the graph show:
- Total Load
- Residual Load (Rload)
The residual load is calculated either as:
- Total Load – Must-run generation
or - The sum of dispatchable generation
Here, we use the second definition.
There is a slight discrepancy in the graph (a thin white area between solar and total load), likely due to reporting inaccuracies — but it’s small enough to ignore for this purpose.
📈 Measuring Balancing Contributions
Now that we’ve linked the dispatchable sources to the residual load, we can quantify their balancing contribution using covariance — a method previously introduced [here]. Covariance tells us how much a power source varies with the residual load — a proxy for how much it helps balance demand.
In this post, we:
- Extend the analysis to Q4 of 2024 (which, notably, increased the fossil contribution),
- Re-classify run-of-river hydro as a must-run source (placing it above the residual load line).
The result is shown below, separated into three time scales:
- Hourly
- Daily (24h aggregation)
- Monthly (30-day aggregation)
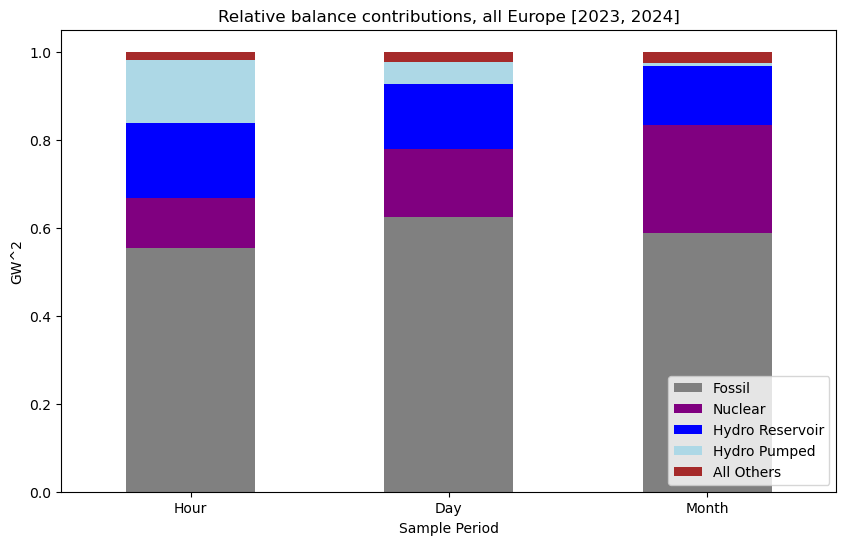
⚖️ Balancing power contributions by time scale
| Source | Hourly | Daily | Monthly |
|---|---|---|---|
| Fossil Fuels | High | High | High |
| Pumped Hydro | Medium | Low | Very Low |
| Reservoir Hydro | Medium | Medium | Medium |
| Nuclear | Medium | Medium | High |
- Fossil power provides around 60% of the balancing capacity at all time scales.
- Pumped hydro is concentrated on the hourly scale, with negligible impact on monthly.
- Reservoir hydro contributes consistently across all scales.
- Surprisingly, nuclear also plays a key role — especially over longer time scales, where it is the second-largest balancing source after fossil.
This nuclear flexibility comes from seasonal load-following behavior, particularly planned maintenance in summer when residual load is lower — clearly visible in the first graph. Additionally, France’s nuclear fleet appears to contribute significantly even at daily and hourly scales.
As noted in the previous blog post on this topic, Europe is facing a growing challenge: as fossil fuels are phased out, the gap they leave must be filled — but just increasing renewable generation introduces an even greater variability in the residual load.
🛢 Fossil Energy “Storage”
Suppose we model fossil energy use as storage-based:
Imagine a central fossil energy store for all-Europe, filled at a constant rate equal to the average fossil power during 2023–2024:
79.35 GW.
Let this store:
- Charge at 79.35 GW continuously
- Discharge at the actual fossil usage per hour
Starting from 0 on January 1, 2023, the storage level evolves as shown:
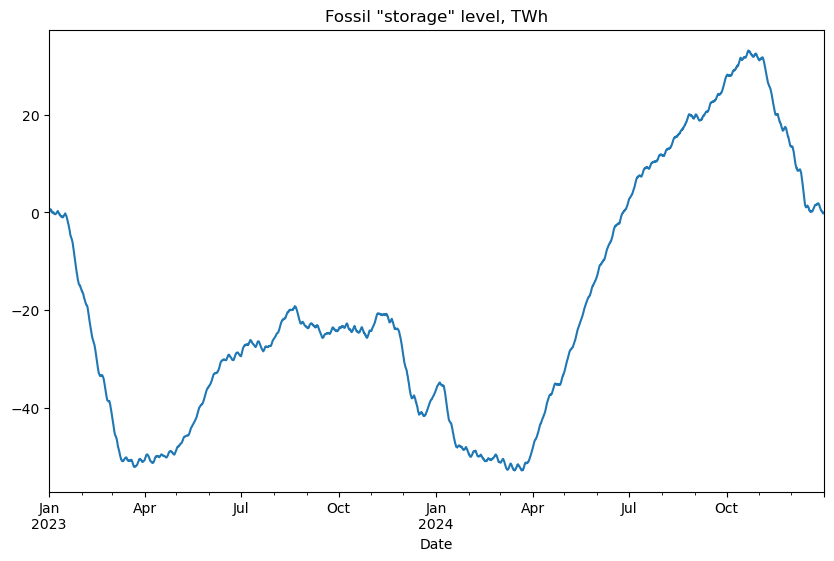
This hypothetical fossil energy store would need a capacity of 86 TWh (difference between min and max). Note: this is delivered electrical energy, not primary energy — meaning the real stored fossil energy would be larger due to conversion losses.
This gives us a useful order-of-magnitude baseline if fossil fuels are replaced by e.g. hydrogen storage. More on that will follow in a future post.