
Bengt J. Olsson
Twitter: @bengtxyz
LinkedIn: beos
Introduction
Model
Results
Conclusions
Update 2023-12-02
Introduction
Offshore wind power and nuclear power are both complex and costly animals. Both are proposed to provide power in bulk to many regions. Just based on LCOE for each power type, offshore wind power has the upper hand based on a slightly lower LCOE in general. But what happens if we try to include balancing costs as well? That is, when we need to provide backup power when the wind is not blowing or nuclear reactors go offline. Who then provides the lower system LCOE?
Model
To investigate this we set up a simplified model. We use a projected consumption case for Germany 2040, given by this report. Shortly consumption can be divided into a “legacy” part of 811 TWh and a hydrogen production part consuming 131 TWh resulting in an energy need of 942 TWh yearly. We assume a seasonal variation of ±15 GW and a similarly sized daily variation. (The latter is less important since the balancing needs are dictated by the seasonal variation anyway). All energy must be supplied by the chosen power source, offshore wind or nuclear power. No import/export is allowed.
In both cases we model a fixed size hydrogen storage of size 100 TWh (measured in power to produce the hydrogen, the corresponding H2 LHV value would be around 67 TWh). This is quite a typical value can be found in reports for the storage size needed for hydrogen in a future Germany. We will keep this value fixed in both optimizations but we will vary the values for a) the electrolyzer capacity needed for producing hydrogen both for “external” delivery for the industry and for power balancing purposes, and b) the hydrogen CCGT capacity needed for power balancing. The round-trip efficiency power -> hydrogen -> power is chosen to be 40%.
Thus, there will be three parameters to vary for each case: (offshore wind or nuclear power production, electrolyzer capacity, H2 CCGT capacity). These values are processed through an optimization algorithm that finds a system with the lowest annualized cost, subject only to the condition that no deficit shall occur. The other (fixed) system parameters are given according to the table below.
| Component | CAPEX (overnight cost) | OPEX (yearly cost) | Lifetime | Capacity factor | Discount rate | LCOE |
|---|---|---|---|---|---|---|
| Offshore Wind power | 2.5 BUSD / GW | 3% of CAPEX ( 75 MUSD / GW / year ) | 25 y | 53% | 6% | 58.3 USD/MWh |
| Nuclear power | 5 BUSD / GW | 3% of CAPEX + 1 cent/kWh fuel cost ( 229 MUSD / GW / year ) | 60 y | 89.7% | 6% | 68.5 USD/MWh |
| Hydrogen Storage | 2 BUSD / TWh 1 | 2% of CAPEX ( 40 MUSD / TWh / year ) | 40 y | N/A | 6% | N/A |
| Electrolyzer capacity | 0.5 BUSD / GW | 3% of CAPEX ( 15 MUSD / GW / year ) | 25 y | N/A | 6% | N/A |
| Hydrogen CCGT capacity | 0.75 BUSD / GW | 2% of CAPEX ( 15 MUSD / GW / year ) | 25 y | N/A | 6% | (see caption) |
1) The cost for the hydrogen storage is lowered to 1 BUSD/TWh in the “Update” section. This may be more in line with costs for large salt caverns and/or depleted gas fields.
Finally, the total cost for the whole system is obtained and annualized using the lifetime and discount rate. The system LCOE is then calculated as this total annualized cost divided by the “useful” energy output, that is the 942 TWh per year of normal consumption plus the hydrogen production for external use.
Offshore wind power production data is taken from ENTSO-E for Danish offshore wind power for the years 2020-2022. It is normalized to conform to the 2022 year level. 53% capacity factor is taken from the Danish “Analyseforudsætninger til Energinet” averaged over their offshore wind power plants 2040.
Nuclear is modeled as 90 reactors with the same constant power output. This output is the parameter that is varied to get a cost-optimal solution, it will become close to 1.35 GW. The variation in total output power will not depend on this level, since it is fixed and the same for all reactors, instead a Markov model is used with random online-offline periods that provide the variation in total output power. This fixed capacity per reactor plus total output energy corresponds to a capacity factor of 89.7% for nuclear power.
Note that the model fully utilizes hydrogen production flexibility. That is, during power deficits hydrogen production is decreased and hydrogen is delivered from the store instead.
Results
Offshore wind power alternative
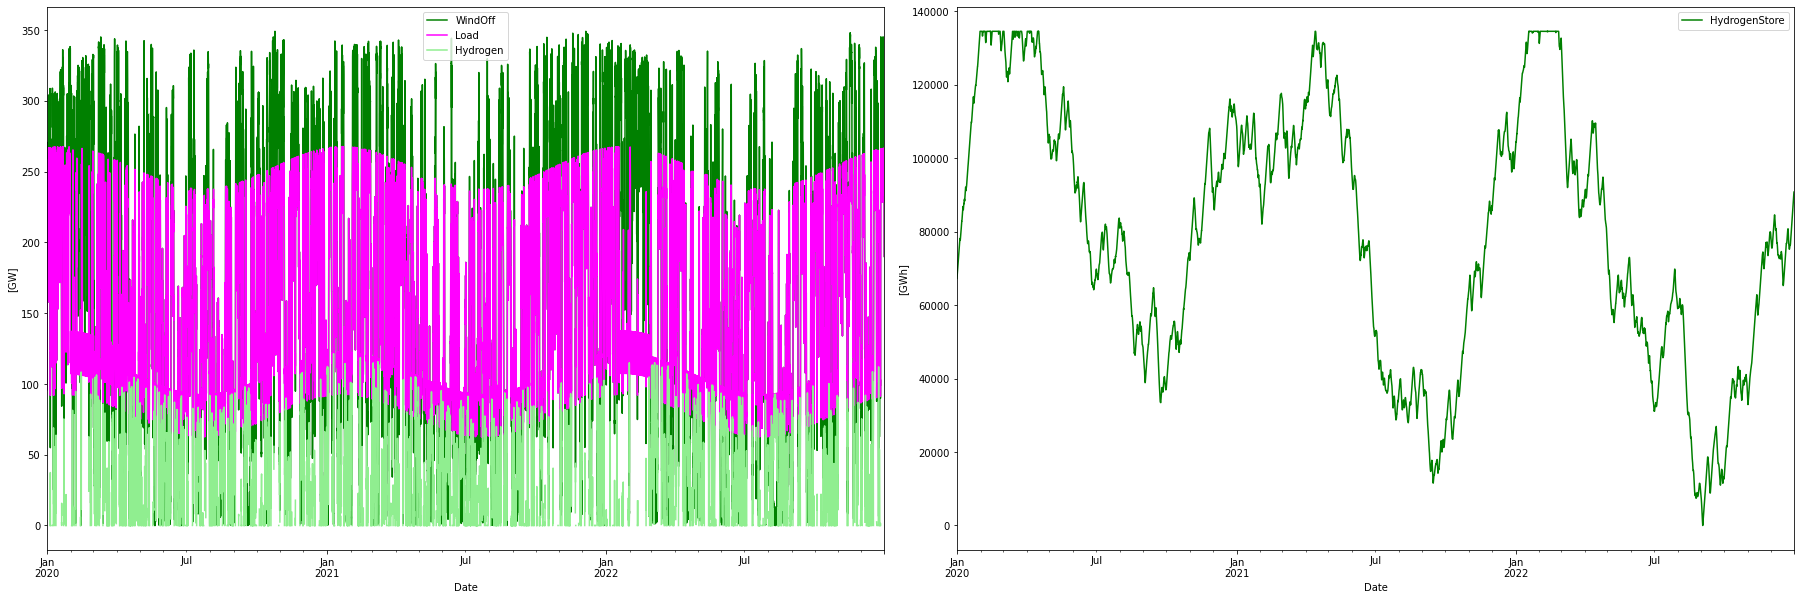
First let’s look at the offshore wind power capacity alternative, that is serving 942 TWh with only offshore wind power, using hydrogen CCGT for balancing. The power dispatch and hydrogen store levels looks like this:
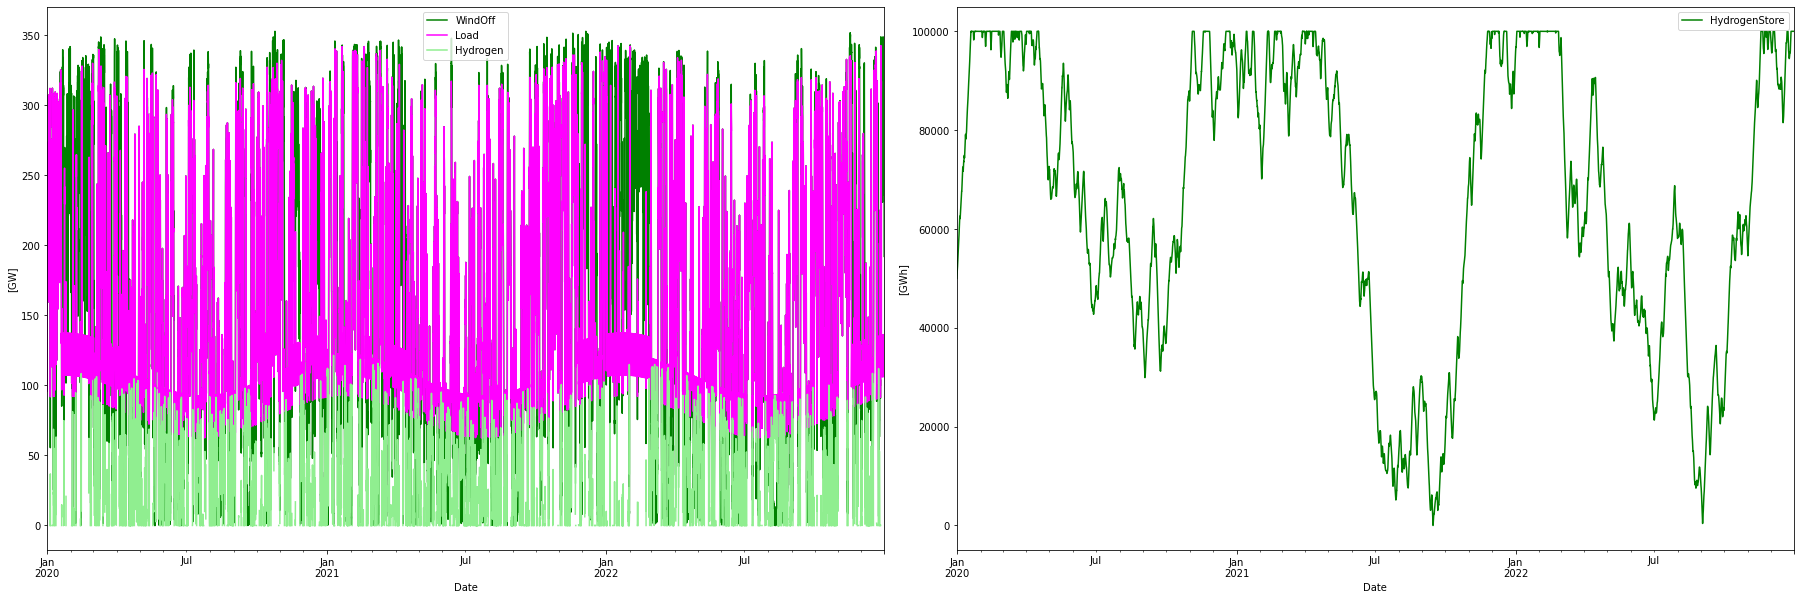
Consumption per year:        1340.73 TWh
Consumption H2 per year:      529.69 TWh
Produced WindOff per year:   1367.44 TWh
Curtailed per year            179.50 TWh
Deficit per year               -0.00 TWh
Hydrogen discharge per year   152.82 TWh
Max overshot:                 246.14 GW
Max shortage:                  -0.04 GW

                  Installed Capacity Unit  TWh/year  CAPEX/GW(h)  OPEX/MW(h)/y   CRF  Tot CAPEX  Tot OPEX  Ann Cost    LCOE
WindOff                     294.530   GW  1367.444        2.500        75.000 0.078    736.325    22.090    79.690  58.277
H2Store                  100000.000  GWh     0.000        0.002         0.000 0.078    200.000     0.004    15.649     inf
H2Elys                      221.698   GW     0.000        0.500        15.000 0.078    110.849     3.325    11.997     inf
H2CCGT                      121.470   GW   152.816        0.750        15.000 0.078     91.102     1.822     8.949  239.47

Total over-night cost         1138.3 GUSD
Total yearly OPEX costs         27.2 GUSD
Annualized cost             116.2852 GUSD
System LCOE                 123.4406 USD/MWh
Energy balance:
Power in:   1367.4 (offshore wind) + 152.8 (hydrogen CCGT) =  1520.2 TWh
Power out: -811.0 (normal consumption) -131.0 (hydrogen delivery) - 152.8/0.4 (hydrogen for CCGT) - 50.0/3 (store starting half full and ending full) -179.5 (curtailed)     = -1520.2 TWh
The system LCOE ends up at 123 USD/MWh. This is much higher than the around 70 USD/MWh that is typically presented for new production. Overproduction and a large amount of backup capacity (more than 200 GW of electrolyzers and CCGT capacity) drive up the price.
Nuclear power alternative
The corresponding dispatch for the optimal nuclear alternative looks like this
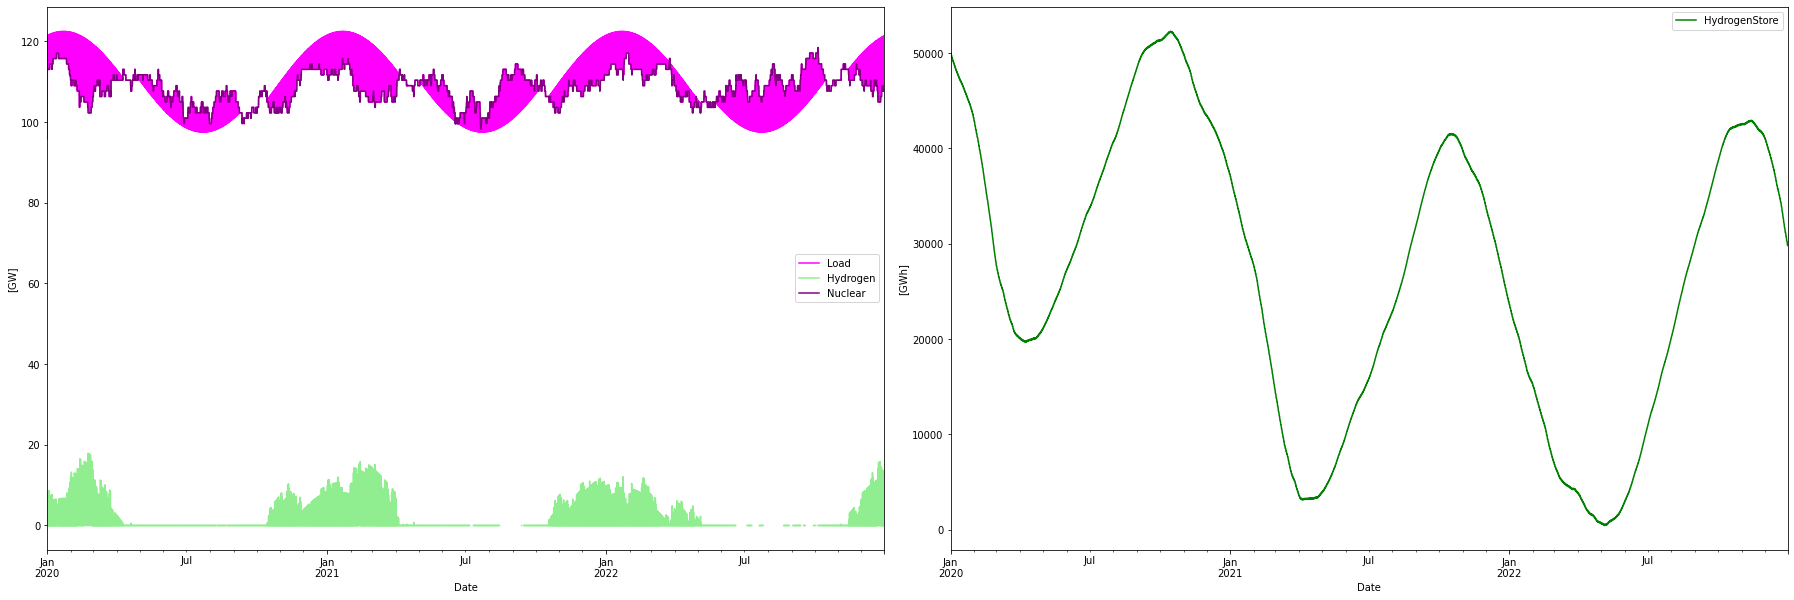
Consumption per year:         955.34 TWh
Consumption H2 per year:      144.30 TWh
Produced nuclear per year:    952.53 TWh
Nuclear capacity factor:        89.68 %
Curtailed per year              5.26 TWh
Deficit per year               -0.00 TWh
Max overshot:                  16.45 GW
Max shortage:                  -0.04 GW

                  Installed Capacity Unit  TWh/year  CAPEX/GW(h)  OPEX/MW(h)/y   CRF  Tot CAPEX  Tot OPEX  Ann Cost    LCOE
Nuclear                     121.140   GW   952.534        5.000       229.000 0.062    605.700    27.741    65.219  68.469
H2Store                  100000.000  GWh     0.000        0.002         0.000 0.078    200.000     0.004    15.649     inf
H2Elys                       35.000   GW     0.000        0.500        15.000 0.078     17.500     0.525     1.894     inf
H2CCGT                       17.903   GW     8.069        0.750        15.000 0.078     13.427     0.269     1.319  2337.6

Total over-night cost          836.6 GUSD
Total yearly OPEX costs         28.5 GUSD
Annualized cost              84.0814 GUSD
System LCOE                  89.2550 USD/MWh
Energy balance:
Power in:   952.5 (nuclear) + 8.1 (hydrogen CCGT)          =  960.6 TWh
Power out: -811.0 (normal consumption) -131.0 (hydrogen delivery) - 8.1/0.4 (hydrogen for CCGT) + 20.6/3 (store starting half full and ending 20.6 TWh lower) -5.3 (curtailed)      = -960.7 TWh
Lower production as well as balancing costs adds up to a much lower system LCOE of 89 USD/MWh. Less overproduction and small amounts of back-up capacity keep the cost lower.
Conclusions
Looking at the components LCOE alone, offshore wind power certainly has the upper hand, weighing in at 58.3 USD/MWh while nuclear costs 68.5 USD/MWh. But after accounting for balancing costs the nuclear alternative became very much more affordable at 89 USD/MWh vs 123 USD/MWh for offshore wind power. The three times higher power spans (350 GW vs 120 GW) that the all wind power scenario shows also implies a difficult system to manage with higher transmission costs as well as ancillary services costs. Transmission and system services are not part of this model.
Now this is of course a very simple model, but it aims to show that LCOE alone is not sufficient to determine the cost-effectiveness of a certain power technology, rather it is important to internalize the balancing costs as well.
Another conclusion is that both offshore wind and nuclear power are expensive, to optimize the system cost lower cost power sources should be added (until their balancing costs offset the savings by using these).
Both systems deliver power without deficit for their consumers and also provide a steady delivery of 131/8.76 = 15 GW of hydrogen to the industry as well. Note that the nuclear alternative only uses half the capacity of the hydrogen store, so it is possible to shave off some system LCOE if this capacity is lowered. And that is possible since it is the relatively steady load variation that determines its size. This is opposed to the wind-powered system where the storage size is determined by the weather pattern. The system is optimized for the weather pattern of 2020-2022 but if this changes for the worse (as it certainly will for some three years…) a larger storage will be needed instead, with increased system LCOE as a result.
Update 2023-12-02: Overproduction in the nuclear power only case
By removing the condition for fixed-size storage, optimization of the nuclear-only case led to a very interesting result. The total system cost was minimized by eliminating the hydrogen CCGTs and shrinking the storage from 100 TWh to 1.1 TWh, which is a 99% reduction of the storage. Also, the electrolyzer capacity was halved from 35 to 17.5 GW, meaning that the electrolyzers now work at a high 85% capacity factor.
All this was enabled by increasing the power of each reactor slightly from 1.35 GW to 1.585 GW. This leads to an overproduction of power, minimizing the need for hydrogen production flexibility and CCGT backup capacity. The power dispatch and storage looks like:
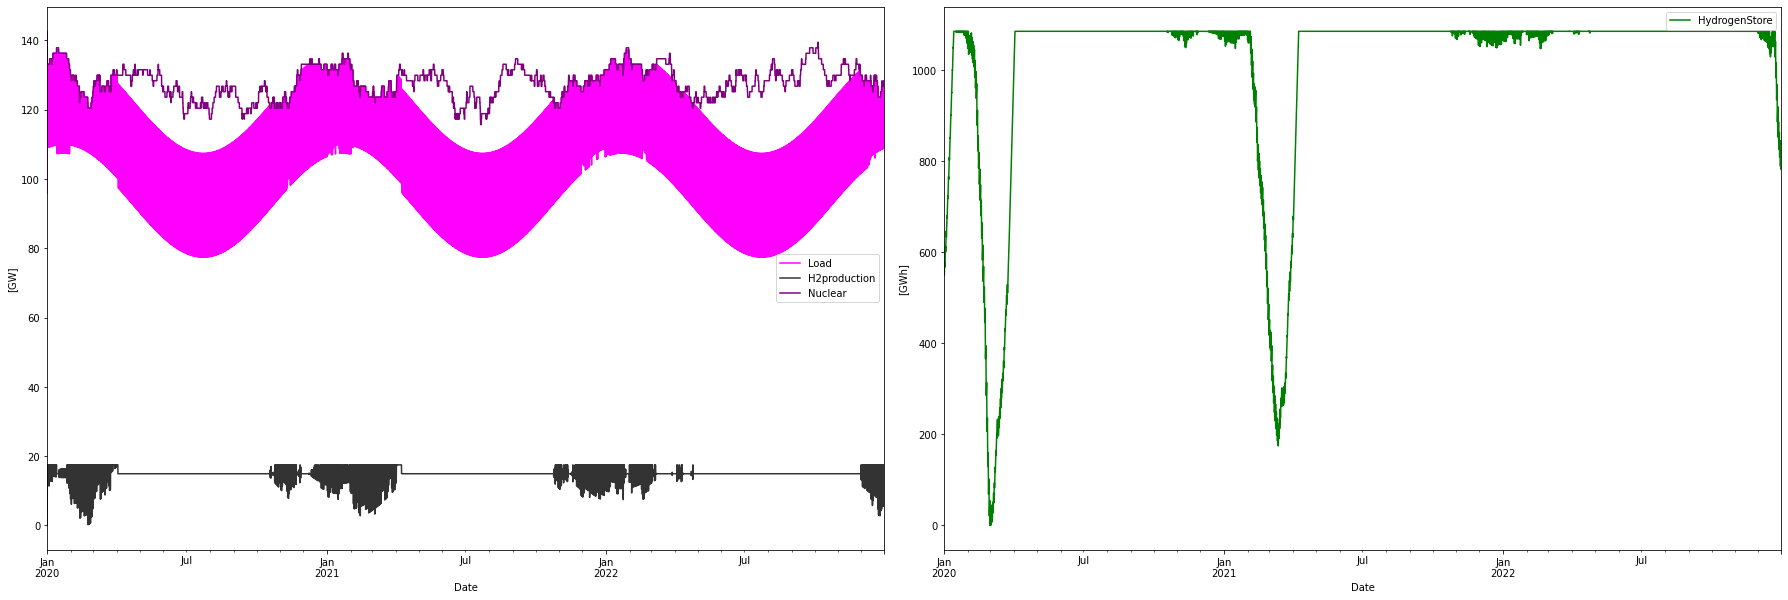
Consumption per year:         942.11 TWh
Consumption H2 per year:      131.07 TWh
Produced nuclear per year:   1121.67 TWh
Nuclear capacity factor:        89.68 %
Curtailed per year            179.54 TWh
Deficit per year                0.00 TWh
Max overshot:                  56.83 GW
Max shortage:                   0.00 GW

                  Installed Capacity Unit  TWh/year  CAPEX/GW(h)  OPEX/MW(h)/y   CRF  Tot CAPEX  Tot OPEX  Ann Cost    LCOE
Nuclear                     142.650   GW  1121.669        5.000       229.000 0.062    713.250    32.667    76.800  68.469
H2Store                    1100.000  GWh     0.000        0.002         0.000 0.078      2.200     0.000     0.172     inf
H2Elys                       17.500   GW     0.000        0.500        15.000 0.078      8.750     0.263     0.947     inf

Total over-night cost          724.2 GUSD
Total yearly OPEX costs         32.9 GUSD
Yearly net exchange costs        0.0 GUSD
Annualized cost              77.9190 GUSD
System LCOE                  82.7135 USD/MWh
We can see that the system LCOE is now down as low as 83 USD/MWh. The system curtails more or less the same amount as in the offshore wind power only case.
Thus, a slight overproduction of nuclear energy provides a very simplified system, without the need for hydrogen CCGT backup power capacity and only needing a small buffer store for continuous delivery of hydrogen to the industry. This to a much lower cost than for a much more complex offshore wind-only system.
From the figure above it could be seen that the overproduction is to a large extent “deterministic” with most overproduction in the summer due to a lower demand. This determinism could be used in for example providing export PPAs with advantageous pricing during the summer seasons. This is instead of curtailing the energy if it can’t be exported on the day-ahead market.
Of course, considering that this is a very hypothetical model, I would still say that the nuclear overproduction case provides a very interesting system solution. It is not a waste, since the total cost is minimized by this overproduction. For a country without large-scale hydropower that can handle balancing, or for countries without the possibility (or not want…) to implement multiple TWh of hydrogen storage, this could be an interesting (and cost-effective) solution. But there is a need for a hydrogen industry since most of the flexibility relies on this hydrogen production.
—
I also took the plunge to fully optimize the offshore wind power-only case as well, by also varying the hydrogen store size. Also lowered the cost of hydrogen storage from $2 to $1 per kWh stored hydrogen. This would give a “rock bottom” system LCOE for offshore wind power alternative at 113 USD/MWh, now with a 135 TWh hydrogen storage but less electrolyzer capacity at 145 GW, and about the same amount of hydrogen CCGT capacity.
113 MUSD/MWh is however still vastly more expensive than the 83 MUSD/MWh for the optimized nuclear-only case. The latter will also have lower costs for transmission and system stability measures.