
Bengt J. Olsson
Twitter: @bengtxyz
LinkedIn: beos
This blog is a translation of an article I wrote for the Swedish on-line magazine Second Opinion.
In this article, Bengt J. Olsson evaluates different methods for generating the green electricity needed for hydrogen production. His conclusion is that electricity from a balanced national electricity system provides the best and most even delivery of hydrogen.
Sweden’s electricity consumption is expected to grow strongly in the coming years. Above all, it is the industry that wants to switch from carbon-based processes to more climate-friendly processes through extensive electrification. Hydrogen is an important feedstock for these processes and the amount of hydrogen that will be required is also expected to grow significantly.
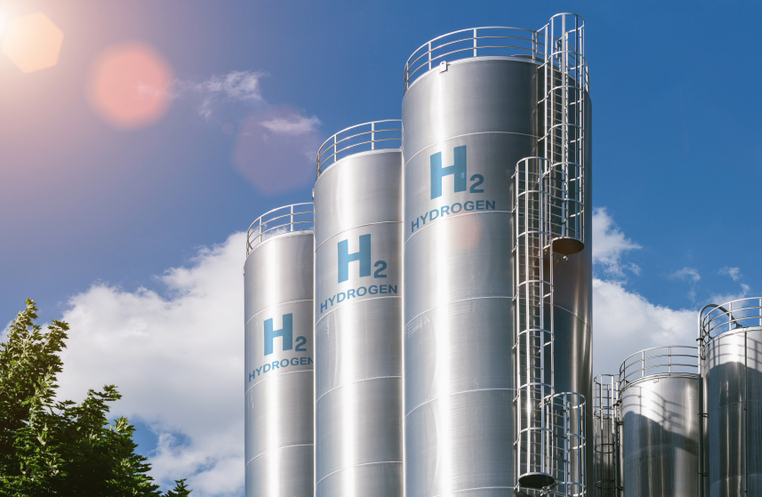
To be climate-friendly, hydrogen must be produced from “green” electricity by electrolysis of water into hydrogen and oxygen. The hydrogen can be used in different ways, for example for direct reduction of iron ore or to create e-fuels. But what they have in common is that they largely replace carbon in the processes and thereby prevent carbon dioxide emissions.
For the industry, it is important that the produced hydrogen can be added to these processes continuously. This is true in general to maximize capacity utilization of the industrial resources, and also these processes generally do not benefit from a variable capacity. If the production of hydrogen is uneven in time, it must therefore be stored in a buffer storage so that the gas can be delivered continuously. How smooth you can do this depends on how the gas is produced and what size the storage facility is. This dynamic quickly becomes quite complex and therefore needs to be modeled to be understandable.
This article evaluates different methods for generating the green electricity needed for hydrogen production, and the interaction with the hydrogen store. The comparison focuses on how well the different solutions can technically generate an even flow of hydrogen to industrial processes. The alternatives evaluated are, on one hand, electricity from the national electricity system, and on the other hand, electricity from nuclear power (SMR) or wind power dedicated to hydrogen production. It will be clear that electricity from a balanced national electricity system provides the best and most even supply of hydrogen. Of the two dedicated systems, the SMR system provides a stable but not as smooth delivery. A dedicated system with wind power will have major challenges in delivering hydrogen in a steady flow to the industry unless hydrogen storage is dimensioned unreasonably large. The myth that you could make hydrogen from excess electricity that would be “free” is also evaluated (and dismissed).
SKGS consumption scenario for 2030
A new report from SKGS1[i], which is a joint organization for Sweden’s basic industries (SKGS is an abbreviation for Forest, Chemistry, Mines and Steel), points at a total consumption in 2030 of as much as 229 TWh, of which 45 TWh is for hydrogen production.
The investigation here is based on SKGS’ consumption figures and a balance model for power system and hydrogen production. By using a balance model for the electricity system in Sweden, it is relatively easy to create an understandable picture of how the electricity system could be developed. Here, such a model is used (described, for example, in this SO-article[ii], but significantly developed since then[iii]), with different assumptions about how the electricity should be produced to meet the electricity demand. In the model, electricity demand is balanced against different types of power production. This production can be of “must run” character (wind, solar, nuclear and here even thermal power will be counted as must run). The balance also includes flexible types of power (hydropower) and other flexible sources such as imports and exports, consumption flexibility and, not least, hydrogen flexibility.
Below is a basic modelling of the SKGS 2030 scenario according to the balance model.
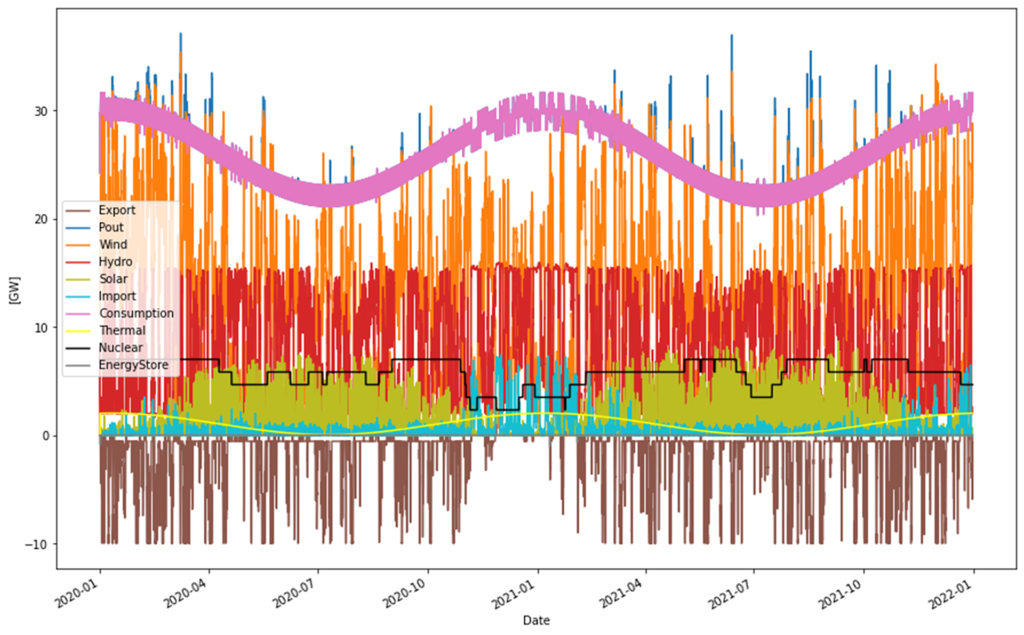
Figure 1: SKGS 2030 scenario with 229 TWh consumption. Consumption (purple) is balanced by wind power (orange), solar power (light green), hydropower (red), nuclear power (black), thermal power (yellow), imports (cyan), exports (brown). Battery storage (gray) is too small to be seen in this image.
| Supplied power per year: 239.52 TWh | Def. store in/out cap 2.00 GW |
| Consumption per year: 228.93 TWh | Def. store storage cap 4.00 GWh |
| Produced hydro per year: 70.07 TWh | Curtailed per year 0.85 TWh |
| Produced thermal per year: 9.08 TWh | Deficit per year 0.01 TWh |
| Produced wind per year: 100.00 TWh | Max shortage: 1.04 GW |
| Produced solar per year: 9.98 TWh | Max overshot: 13.61 GW |
| Produced nuclear per year: 50.39 TWh | Import per year: 5.00 TWh |
| Nuclear capacity factor: 82.06 % | Export per year: 14.75 TWh |
| H2 production per year: 45.02 TWh | Consumption flexibility: 3.00 % |
| H2 delivered per year: 45.00 TWh | Hydrogen flexibility: 20.00 % |
| H2 store size 0.10 TWh | Nominal non-H2 cons. 184.00 TWh |
| Capacity electrolyzers: 5.70 GW | Real non-H2 cons. 183.91 TWh |
| Cap. util. electrolyzers: 90.16 % | Flexibility loss: 0.05 % |
There is a lot to say about this scenario, but in short, a total consumption of 229 TWh is obtained, which is serviced by 100 TWh wind power, 10 TWh solar power, 70 TWh hydropower (of which some TWh are imports from Norway), 9 TWh bio/thermal power and finally just over 50 TWh nuclear power. The expansion of production has thus been made only with wind and solar power, the others are at the same levels as today.
Imports are at about the same level as today. Exports, although lower than today, are still significant at about 15 TWh.
The power balance is maintained in deficit situations with, in addition to imports, consumption flex (3% or about 750 MW), hydrogen flex (20% or just over 1 GW) and for shorter periods 2 GW battery storage. As can be seen, this is almost enough, there is still some occasion with 1 GW deficit for a few hours. In reality, this would probably be covered by sacrificing the limited hydrogen flex and flexing down another 20%. During these hours, the industry would be guaranteed about 3.4 GW of hydrogen against 4.5 GW at the normal 20% flex, which is probably an acceptable cost. Note that the model, with its sinusoidal form of both annual and daily variation in consumption, underestimates shorter peak and troughs.
Here, an import capacity of 10 GW has been adopted, which can contribute extra power in the event of a deficit. It is not always obvious that the import power will be available when needed, and together with instantaneous consumption peaks, there is a great risk that the power shortage will be significantly greater than the 1 GW from the table.
Only 0.85 TWh is curtailed. This presupposes that really as much as 15 TWh can be exported. Here too, 10 GW is used as export capacity.
In general, it can be said that the weather pattern from 2020/2021 showed an unusually weak wind around the turn of the year when consumption is also at its highest, which of course is a somewhat difficult case. In addition, the random nuclear power has a number of reactors that are at a standstill at the same time and add to the difficulties. This will be reflected in the hydrogen production that will be evident.
Dynamics of hydrogen production
In our first model, hydrogen is produced continuously, using electricity like any other application. Production is then within the “consumption profile”. That is, for the electricity system it makes no difference that it is hydrogen that is produced or if it is other consumption, it is the total consumption of 229 TWh that must be met by the electricity system.
Since hydrogen production is considered ordinary consumption, it follows that the price of electricity for hydrogen production will be largely the same as for other consumption.
However, there is a difference to other consumption: Hydrogen production has more flexibility than other consumption. The model assumes that regular consumption can flex down 3% (i.e. 3% of the power that regular consumption has at the moment), while hydrogen production can flex down 20% of its normal consumption which in this case is 5.7 GW (capacity of the electrolysers). 20% of 5.7 is approximately 1.1 GW. This could be reflected in a reduction in the cost of electricity.
Why has 20% flex been chosen and not, for example, 100% flex? Because there is a requirement to deliver hydrogen at a steady rate to industry. With 20% flex, in every hour can be guaranteed delivery of at least 4.6 GW of the 5.7 GW nominally produced. This is whether there is hydrogen in the storage or not, which is important and facilitates the requirements for large storages. But it is also likely that for short periods of time you will flex down significantly more (especially if there is hydrogen in the storage) if necessary to avoid a rotating disconnection of consumers.
In the SKGS model above, a hydrogen storage size of 100 GWh has been adopted, corresponding to the store sizes that LKAB refers to for its direct reduction of iron ore. With 5.7 GW electrolysers, 45 TWh of production per year is obtained with a 90% capacity utilization of the electrolysers.
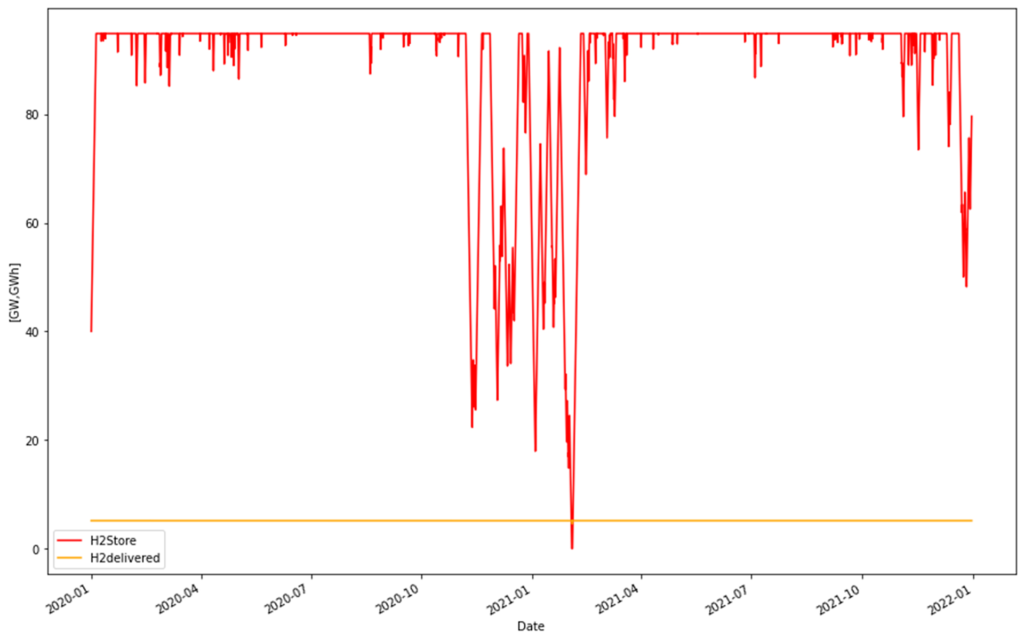
Figure 2. Filling of storage (red) in GWh and extraction of hydrogen (orange) in GW
A continuous withdrawal of 5.1 GW (equivalent to 45 GWh on an annual basis) is available almost all the time. Just a few hours during February 2nd, delivery is slightly lower due to an empty store and down-flexed production.
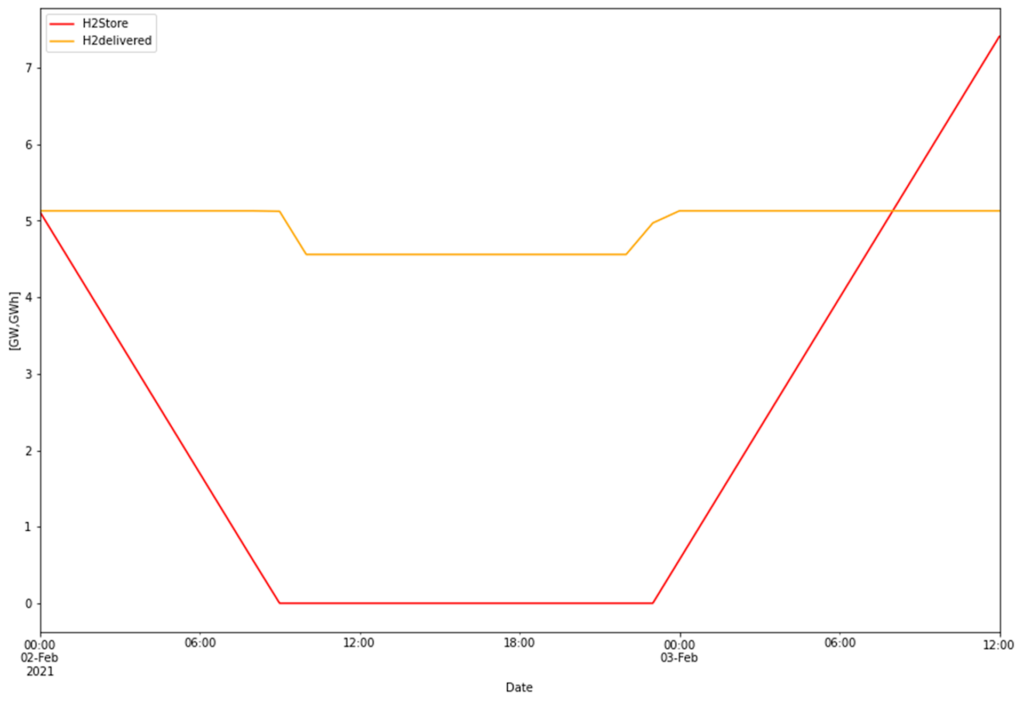
Figure 3. Enlargement of February 2nd when the hydrogen storage facility runs empty. The output is 4.5 GW against the normal 5.1 GW for a few hours.
A particularly stable hydrogen production is thus obtained, despite rather difficult conditions for production (low wind, nuclear un-availability).
With this stable electricity supply, the requirement for the size of the storage is reduced. If the size of the storage in the simulation changes from 100 GWh to 16 GWh, the hydrogen extraction will only decrease marginally, from 45 TWh to 44.76 TWh or a reduction of half a percent. Hence the importance of continuous electricity supply for hydrogen production.
The myth of “free electricity” for hydrogen production
In the example above, it has been assumed that “ordinary” electricity is used for the production of hydrogen. But many proponents of wind and solar power in particular argue that surplus electricity can be used for the production of hydrogen, i.e. electricity that is not used for other consumption. Unfortunately, this is misconceived in two ways. Firstly, this surplus electricity is not “free” but would otherwise be used for export, so that electricity has an opportunity cost.
Secondly, the amount of hydrogen that can be produced in this way is minimal in relation to the consumption need and the investment of electrolysers. To see this let’s once again look at the SKGS 2030 scenario. In this case, it is assumed that the electricity system should only supply energy for consumption that is not hydrogen production (that is,184 TWh) and then hydrogen is produced from surplus energy in wind/solar power peaks. Electrolysers thus work above the consumption profile. Now the system is rebalanced for 184 TWh consumption instead of 229 TWh. To do this, wind/solar power is reduced to 47.5 and 5 TWh respectively (that is, a total of 57.5 TWh is deducted from production), but other power sources remain as is. The same 5.7 GW electrolysers are used here to utilize only surplus energy.
The following electrical systems are then obtained:
| Supplied power per year: 181.93 TWh | Def. store in/out cap: 2.00 GW |
| Consumption per year: 185.17 TWh | Def. store storage cap: 4.00 GWh |
| Produced hydro per year: 69.96 TWh | Curtailed per year: 0.00 TWh |
| Produced thermal per year: 9.08 TWh | Deficit per year: 0.00 TWh |
| Produced wind per year: 47.50 TWh | Max shortage: 0.00 GW |
| Produced solar per year: 4.99 TWh | Max overshot: 0.00 GW |
| Produced nuclear per year: 50.39 TWh | Import per year: 3.26 TWh |
| Nuclear capacity factor: 82.06 % | Export per year: 0.01 TWh |
| H2 production per year: 1.15 TWh | Consumption flexibility: 3.00 % |
| H2 delivered per year: 1.18 TWh | Hydrogen flexibility: 20.00 % |
| H2 store size: 0.10 TWh | Nominal non-H2 cons. 184.00 TWh |
| Capacity electrolyzers: 5.70 GW | Real non-H2 cons. 184.02 TWh |
| Cap. util. electrolyzers: 2.31 % | Flexibility loss: -0.01 % |
In addition to wind and solar power, the same power is produced as in the previous system. The system behaves well without deficits or curtailments. But with hydrogen production only from excess power that is above the consumption profile, a total hydrogen production of only 1.15 TWh is obtained! Which is also delivered very irregularly in smaller bursts.
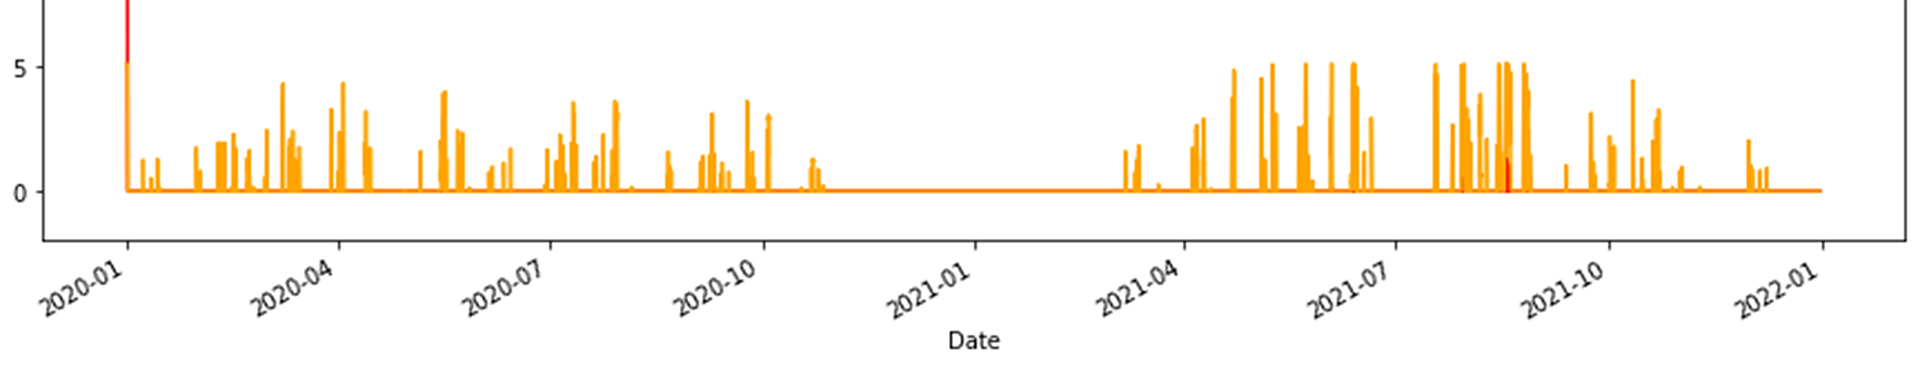
Figure 4. Delivery of hydrogen produced from power peaks in the 184 TWh electricity system
These 1.15 TWh would have been fully exported if they had not been used for hydrogen production, so it is not a question of free energy either. For the SKGS scenario, this method can probably be written off for to produce hydrogen, although electricity would be slightly cheaper in this case.
Separate electricity grid for hydrogen production
Here it is assumed that the regular electricity grid is as in the latter scenario, i.e. for 184 TWh without hydrogen production. In addition, a separate electricity grid is being built to produce only 45 TWh of hydrogen. This is done using the following two options:
1. With nuclear power (SMR)
2. With wind power
Option 2 only uses wind power for simplicity, a combination of wind and solar power could also be used but this would not significantly change the results. It is also conceivable that these separate electricity grids would be built in the north of Sweden where wind power is probably more useful than solar power.
Note that these options are only principled, in reality the above system would be connected to the common electricity grid in one way or another. (For example, to sell surplus electricity from wind power when the hydrogen storage is full).
45 TWh with nuclear power
In the case of hydrogen production with 45 TWh nuclear power, the electricity system is modeled with 19 SMR power plants of 300 MW each with a 90% capacity factor = > 45 TWh of electricity per year. The maximum power will be 19 x 0.3 = 5.7 GW and it is also the electrolysis power that is used.
Availability of these SMRs is simulated with a Markov process and randomized until close to 90% capacity factor is obtained. In this simulation, a maximum of 5 SMRs are down at the same time, which gives a maximum production loss of 1.5 GW. If it is acceptable with a variation in the order of 1.5 – 2 GW (then gives 3.7 GW in minimum production) then no storage is needed, the production is already a relatively stable.
However, if you want a more even delivery of hydrogen than in the figure below, relatively large stocks will be needed to get a significant improvement in smoothness.
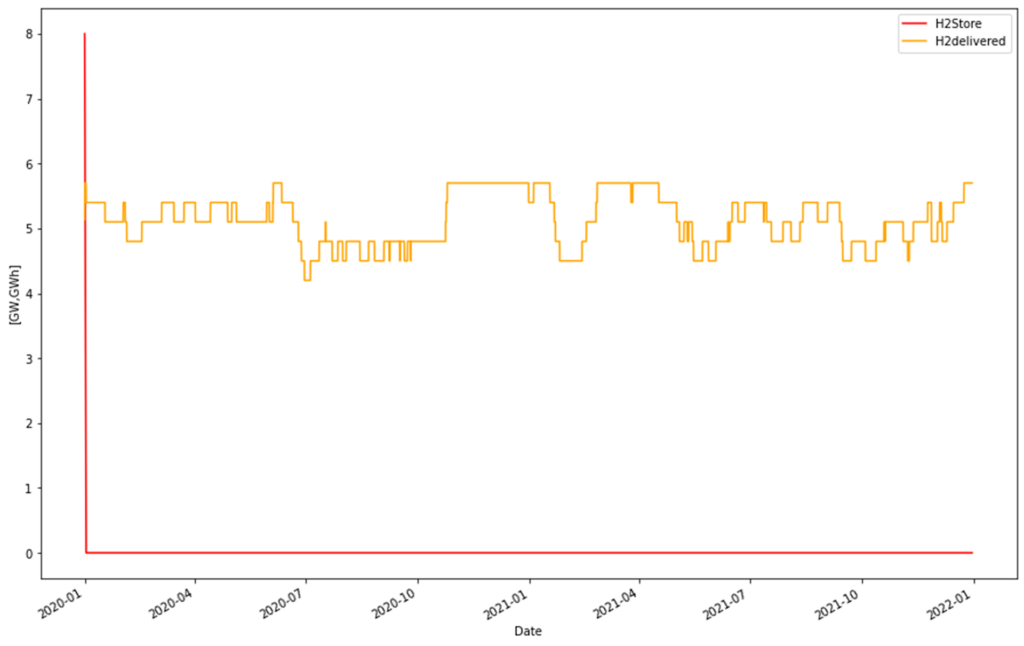
Figure 5. Delivery of 45 TWh of hydrogen per year produced with 19 x SMR of 300 MW each. The hydrogen is delivered directly without stock.
Interesting with this alternative is that the efficiency of hydrogen production is probably also higher as you can take advantage of both electricity and heat from the SMRs.
45 TWh of wind power
In this alternative, 45 TWh of wind power was used to produce the hydrogen. The same wind power statistics as in the previous models are used, but are scaled down to generate 45 TWh on an annual basis. The statistics for both wind and solar power are from ENTSO-E for Denmark 2020-2021. Denmark has been chosen because they already have a mix of onshore and offshore wind power, and because they have statistics for solar power, this is not included in the Swedish statistics yet. Previous models have used Swedish wind power statistics for 2020–2021 and they have given similar results, so it is quite unclear which wind statistics you choose. On the one hand, the wind systems are large and therefore give similar results, and on the other hand, it is still only one of many wind outcomes studied here.
Electricity production with only wind thus looks like this:
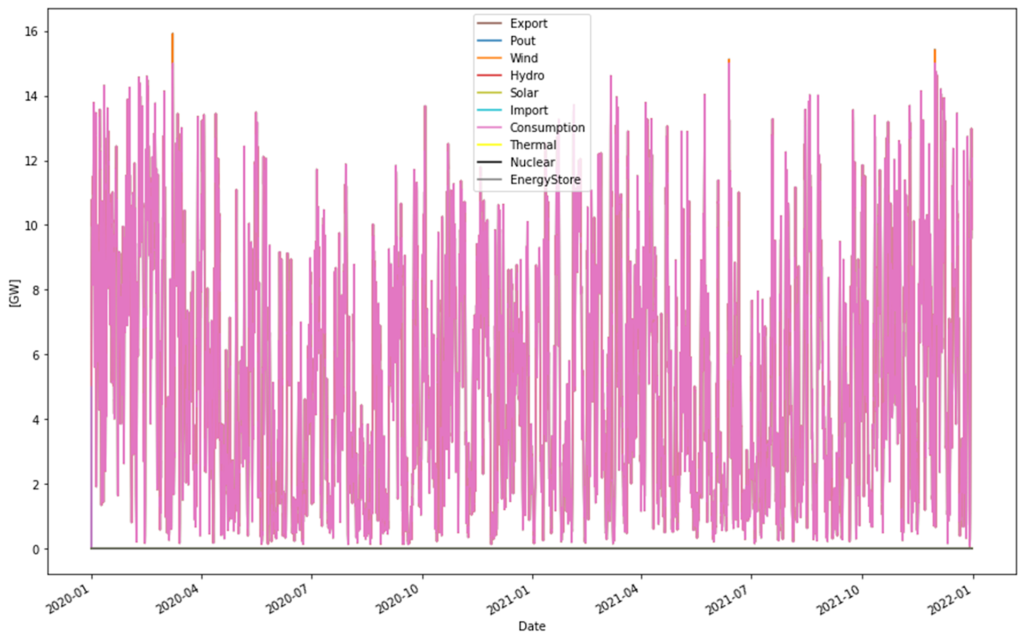
Figure 6: Wind power generation generating 45 TWh annually. 15 GW electrolysers make almost all electricity consumed, a few orange peaks can be seen over 15 GW.
Here, 15 GW of electrolysers are used to take care of virtually all the electricity produced. This means that the capacity factor for the electrolysers will be the same as for wind power itself, here 34%. (This was also the case for the SMR option, although there that factor was about 90%).
With the variability in wind power production, roughly from 0 – 15 GW, storage management becomes extremely important. In the previously referred to article, an unreasonably large storage was shown to be needed in order to obtain a steady supply of gas. It still applies for a completely even hydrogen supply out as can be seen in the following graph.
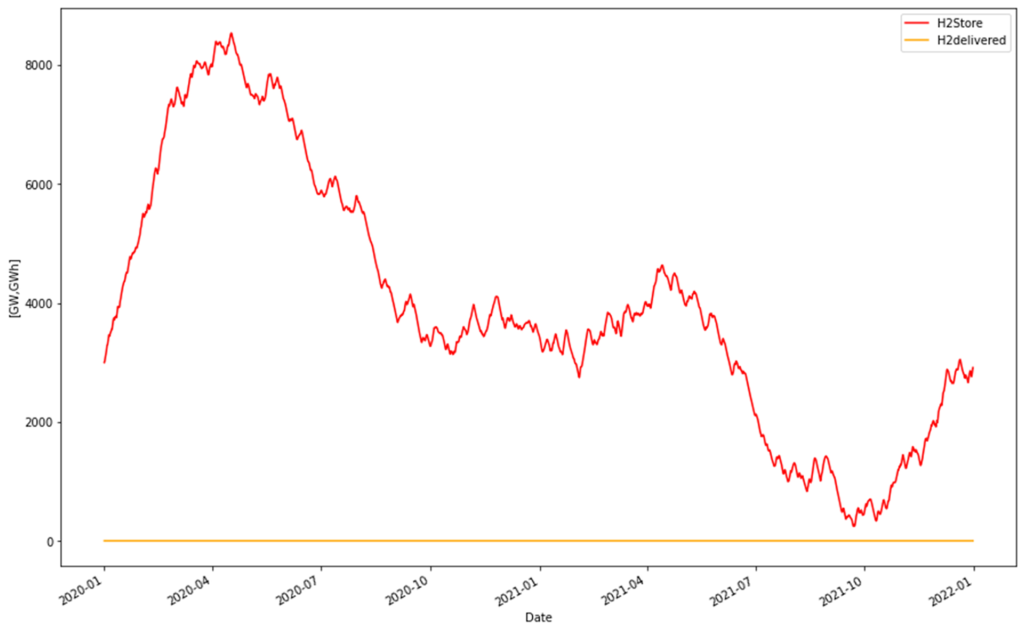
Figure 7: A storage of about 9 TWh is required for the delivery of a perfect 5.1 GW hydrogen gas stream for the 45 TWh wind power system.
This is not reasonable in any way for Sweden at least. If the size of the storage is limited to 100 GWh, a lower total production, about 36 TWh instead of 45 TWh, is obtained, and a very uneven delivery. Below is an enlargement of January with deliveries between a maximum of 5.1 GW and down to roughly 0 GW. This is because when the storage is empty, only the direct hydrogen production, which is equal to wind power production, can be delivered. And it can be arbitrarily small depending on the strength of the wind. Only when wind power produces more than 5.1 GW do the storage begin to fill up. If the wind blows too much, the storage is quickly filled to 100 GWh and excess electricity is wasted in this model, with the result that a lower total volume of gas can be generated (here 36 TWh per year).
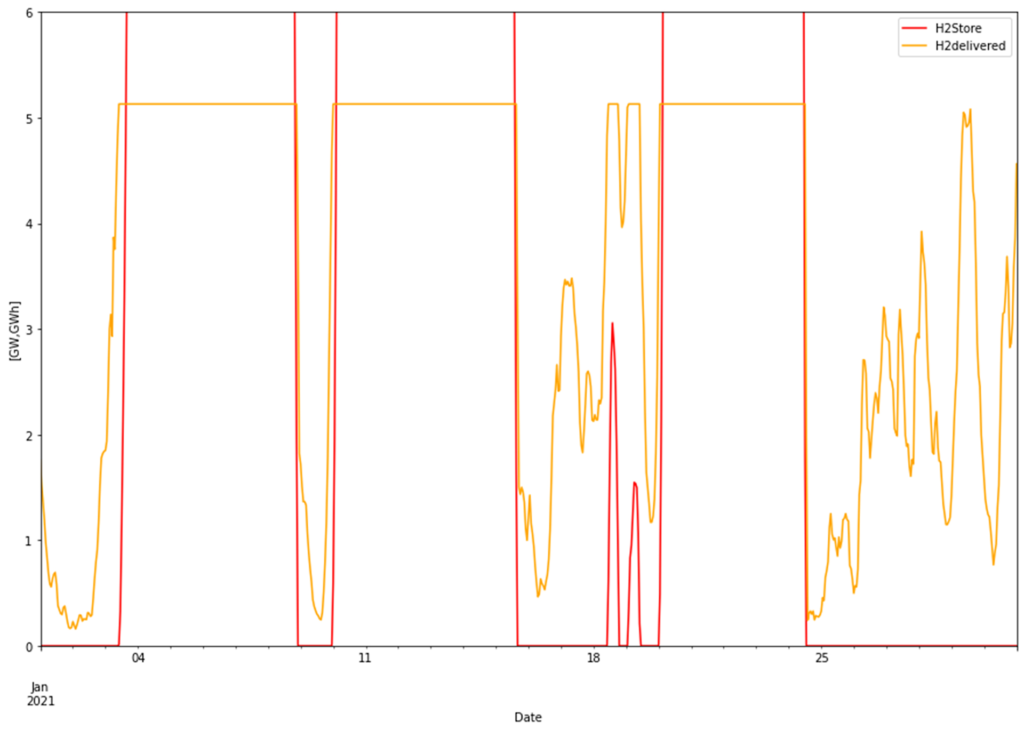
Figure 8: Expansion of hydrogen delivery from a 100 GWh warehouse for January 2021.
Adaptive outlet from the storage
By sacrificing the smoothness of the delivery, the storage size can be reduced without losing hydrogen. This can be done by varying how much you deliver out as a function of how much comes into the storage. That is, if more gas comes in, you may temporarily also output more gas and thus keep the storage level down.
Technically, this can be achieved by “low-pass filtering” the incoming amount of gas. To reduce the storage size from 9 TWh to 100 GWh (without losing hydrogen), you need to filter with a time constant of about 10 hours. However, the variation will then be about 0 – 13 GW (see Figure 9), which is a small difference compared to delivering the gas directly with a variation of 0 – 15 GW. This highlights the difficulties of obtaining a steady hydrogen flow in this alternative.
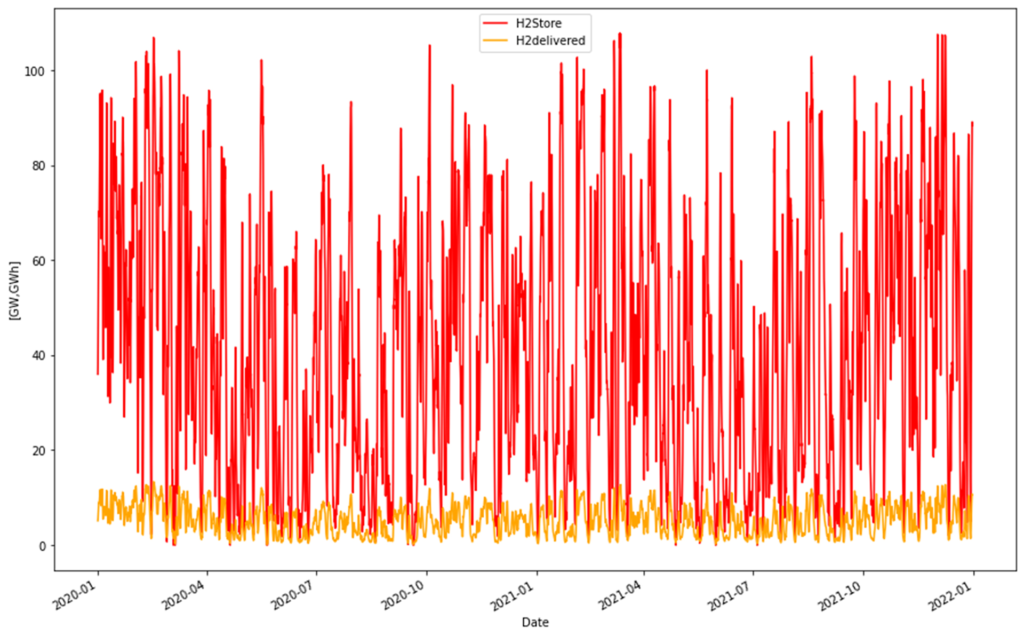
Figure 9: A low time constant results in a “supple” withdrawal and thus a lower storage requirement, but at the cost of a more uneven delivery of hydrogen.
If it is assumed that it is possible to specify a lower limit for the variable hydrogen output, e.g. 3 GW, so that at least this extraction can always be guaranteed, a time constant of 500 hours is needed for the filter and a storage filling and delivery as shown below is obtained.
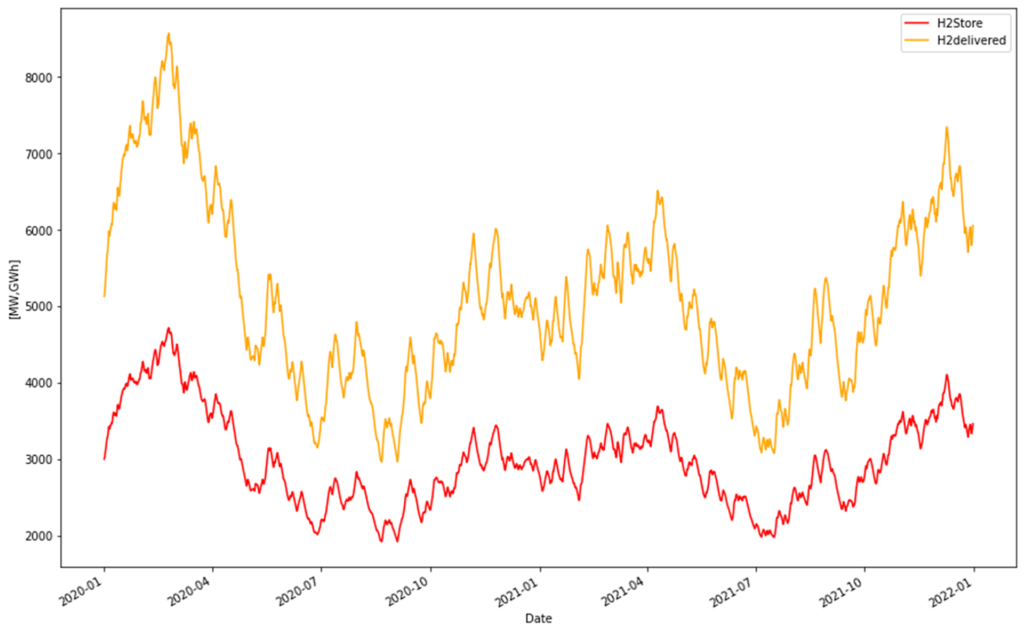
Figure 10: Same simulation but now with a slow filter of 500 hours. Note that the withdrawal rate here is measured in MW instead of GW.
Here, the goal of always delivering at least 3 GW has been achieved, with a variation of about 6 GW, but to achieve this, a storage with a size of about 3 TWh or 30 LRC storage units of 100 GWh each is still needed.
For wind power-produced hydrogen, we are thus faced with a choice, either stable delivery of hydrogen and then gigantic hydrogen storage will be needed, or the industry will have to adapt its processes for intermittent access to hydrogen. This is ultimately a cost issue where the price tags for the two choices are unknown but undoubtedly very high. In any case, the conclusion here is that hydrogen produced from wind power alone will not be able to meet the industry’s need for continuously supplied hydrogen without having unreasonably large hydrogen storages.
Conclusions
Based on a new consumption scenario from SKGS for 2030, 4 ways to produce the 45 TWh of hydrogen included in their scenario have been studied.
1. From a balanced electricity mix in our common electricity system where hydrogen production is considered as any other consumption (but with the possibility of higher flexibility than for other consumption). This provides stable hydrogen production with only the need for small buffer stocks. The hydrogen producer pays according to the “normal” electricity price tariff.
2. From excess power in electricity systems dimensioned to serve a normal consumption (i.e. without hydrogen production) of 184 TWh according to SKGS’ scenario. The surplus in this system is only capable of producing 1.15 TWh of hydrogen, so this is not a viable option.
3. As option 2, but with a separate electricity system consisting of 19 SMR power stations of 300 MW each. These deliver 45 TWh without the need for storage but with a variation of about 1-2 GW depending on how many SMRs are simultaneously unavailable. The same high (here 90%) capacity factor on both SMRs and electrolysers.
4. As option 3, but with 45 TWh from wind power. In this option, there are problems with security of supply. It is not possible to guarantee a lower limit for hydrogen supply without having unreasonably large hydrogen stocks.
It is clear that the national electricity system, with its balancing mechanisms, provides the best supply of hydrogen. This option should also have the highest electricity price logically. Alt 4 with only wind power is the cheapest alternative but is not able to deliver the hydrogen at the steady pace that the industry needs. Option 3 is an uncertain bet for 2030 as it is not clear how SMR power will develop in this time perspective.
In general, the conclusion is to continue to expand the national electricity system and ensure that it provides a sufficient level of security of supply. Until 2030, it looks like it will work with more wind and solar power, but clear signs are also seen of power shortages and import dependence already then in this simulated system. Therefore, SMR is particularly welcome to brace up the future system, which can then become an optimal mix of both planable and renewable fossil-free power sources.
[i] https://www.skgs.org/rapport-industrins-elbehov-till-2030/
[ii] https://second-opinion.se/orimligt-stora-lager-vatgas-for-att-jamna-ut/
[iii] https://adelsfors.se/2023/04/12/power-to-products-scenario-for-finland-2035