
Bengt J. Olsson
Twitter: @bengtxyz
LinkedIn: beos
RethinkX has presented a proposal for replacing Germany’s power system with an all renewable power system consisting of wind and solar power only, and with batteries as back-up/balancing source (a “SWB” system). It would also be a completely self-sufficient power system, with no import dependence. From a modelling point of view this is a quite nice system since there are so few sources and balancing mechanisms. But how does this model stack up vs reality? Let’s have a look at it in more detail!
500 TWh SWB system
The report suggest the following numbers:
With this production capacities the authors claim to produce 630 TWh annually. That is 500 TWh for consumption and 130 TWh in so called “super power”. (This is normally called “excessive power” since it is not part of the consumption profile, and if it is not exported or consumed otherwise it is curtailed). Note that import/export is not allowed in this model, since it should be a self-sufficient system.
Let’s also look at the actual wind/solar power production numbers for 2022.
| Germany 2022 | Installed Power (average over year) | Produced Energy | Capacity factor |
|---|---|---|---|
| Wind | 64.9 GW | 123.4 TWh | 21.7% |
| Solar | 63 GW | 57.6 TWh | 10.4% |
A first observation is that with the 2022 number on capacity factors it will be hard to reach 630 TWh just looking at the solar/wind power production:
(210 GW x 10.4% + 180 GW x 21.7%) x 8.76 kh = 533.5 TWh
Almost 100 TWh of energy is lacking if using the capacity factors of 2022. So somehow these factors must be increased by about 20%. This may be viable with more off-shore wind power plants, but it should be noted at least.
The numbers indicate an increase of about 3 times the 2022 installed capacities of wind and solar power. This will of course consume big areals both on-shore and off-shore.
Let’s look at the derived cost for this system. (All costs here are so called “overnight costs”, that is the actual up-front cost of the systems, without any financial costs incurred). Assuming the already installed PV and wind power capacity is “sunk cost”, the additional cost to reach the final capacities, plus cost for batteries are listed below.
| Capacity [GW,GWh] | Cost [USD/kW,kWh] | Cost [GUSD] | |
|---|---|---|---|
| Solar | 147 (210) | 300 | 44 |
| Wind | 115 (180) | 900 | 104 |
| Batteries | 6221 | 35 | 218 |
| Total | 366 |
The cost numbers are taken from the methodology document, extrapolated to the year 2028. This year is chosen since the cost estimates for 2028 gives a total cost of 366 GUSD which is close to the given 367 GUSD stated above. It is left to the reader to judge if these costs are realistic or not. The battery storage cost of 35 USD per kWh seems very optimistic. Also wind power costs are extrapolated from on-shore power plant costs, while we expect the major increase to become off-shore plants (in order to increase the capacity factor above) that is more expensive than on-shore plants.
Battery storage makes up the major part of the cost, which could be expected. 6.2 TWh of batteries is a lot! (Too understand how much this is, consider a nuclear power plant of 1 GW. It would have to supply all its power continuously to the battery store for 8.5 months in order to charge it, from empty to full).
A reality check can be given by the press release for a report from a major analysis company. They forecast the total world-wide cumulative installed battery capacity in 2030 to be 500 GW / 1.34 TWh. From the press release it can be deduced that the average cost will be around 250 USD / kWh for this capacity. These numbers do not agree well with the RethinkX battery projections.
Simulation of the SWB system
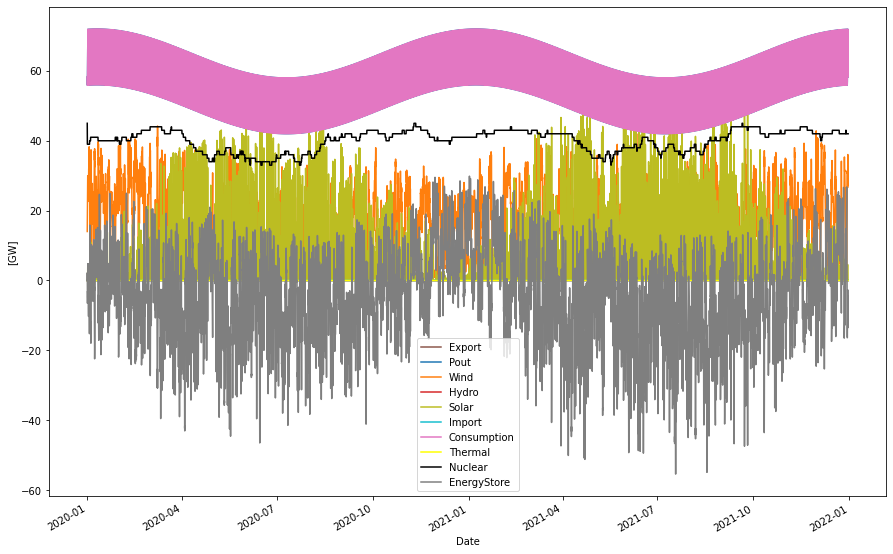
How would this system perform in an actual simulation? Below is the result of a simulation where the wind and solar powers are set to produce 630 TWh of energy and balance this power with 6.2 TWh of energy storage. In this particular simulation we use Danish wind and solar power data for 2020 and 2021 and scale this data to produce the required amount. The Danish wind data contains both onshore and offshore wind power. Also the solar power distribution should at least be close to what Germany would get.
The two weather years 2020 and 2021 are peculiar in one respect: The wind was unusually low during the mid-winter, when also the demand is highest so there will be a need to store energy for this period as we will see.
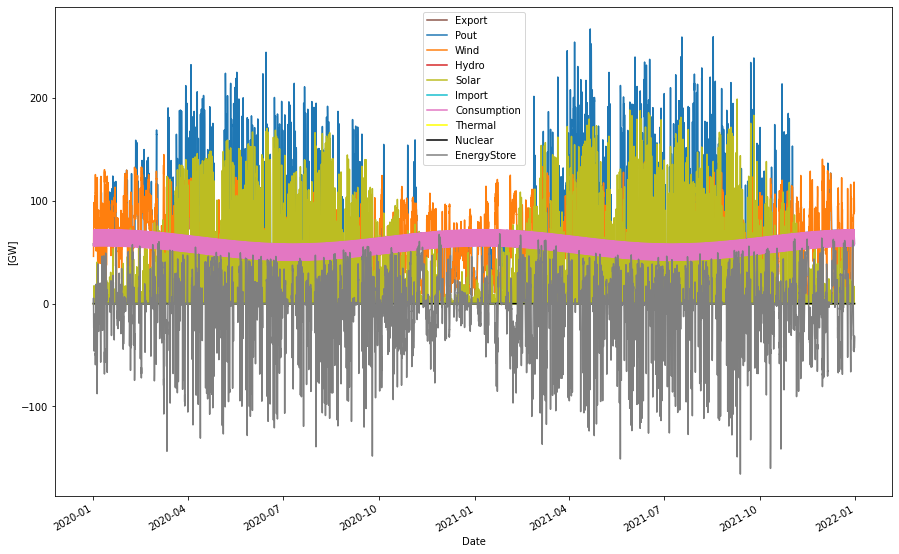
Supplied power per year:      629.98 TWh
Consumption per year:         500.34 TWh
Produced wind per year:       409.70 TWh
Produced solar per year:      228.45 TWh
Energystore in/out cap        200.00 GW
Energystore storage cap      6221.00 GWh
Energystore In                -89.69 TWh
Energystore Out                81.52 TWh
Curtailed per year            147.55 TWh
Deficit per year               17.91 TWh
Max shortage:                  68.99 GW
Max overshot:                 203.83 GW
Import per year:                0.00 TWh
Export per year:                0.00 TWh
From the data above it can be seen that 638.15 TWh of wind and solar power is generated, but 8.17 TWh are lost in the battery charging/discharging cycle, thus supplying 629.98 TWh for consumption and “super power”. The nominal 500.34 TWh consumption actually becomes 500.34 – 17.91 = 482.43 TWh due to the deficit that occur. The difference between the supplied 629.98 TWh and the consumed 482.43 TWh is the curtailed (or “super-power”) amount of 147.55 TWh (instead of about 130 as suggested in the RethinkX model, who’s model weather year probably was more windy during the mid-winter). This is the energy balance.
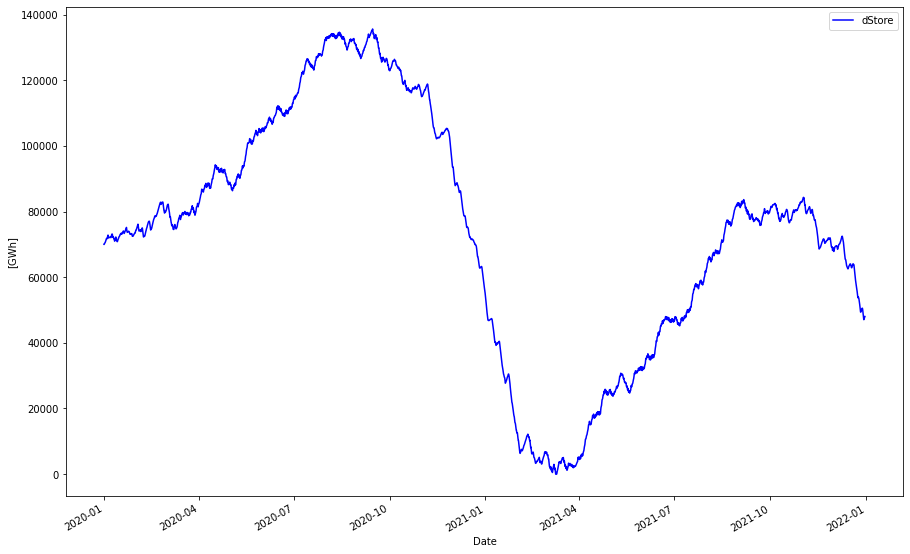
The battery store is 6.2 TWh with an input and output capacity of 200 GW. This makes the battery a 31 hour storage system. The fill level of the store is seen in the graph below.
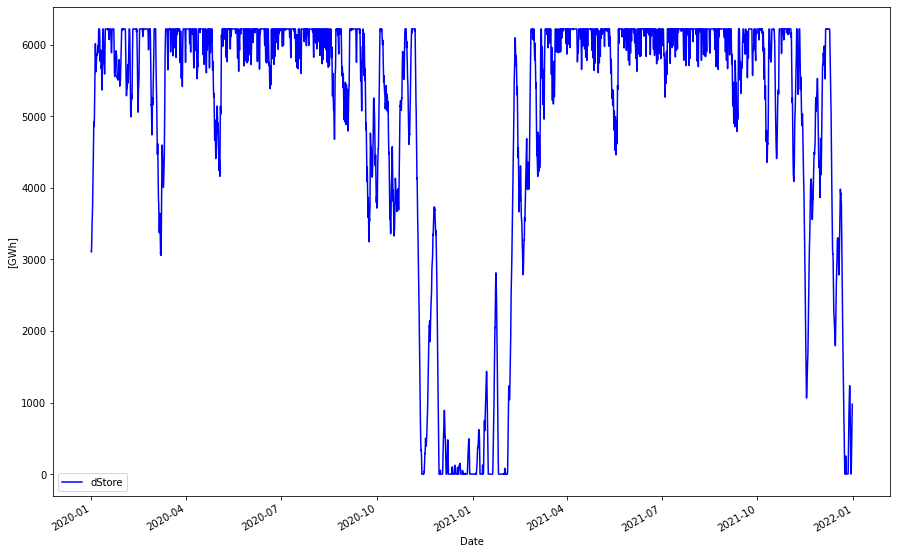
It starts out half filled and quickly becomes full. When it is full and the power generation is above the consumption we get “super power” (or curtailment as it is called in this model). During the mid-winter months the battery store is completely discharged during periods. At these periods we thus get a deficit of power.
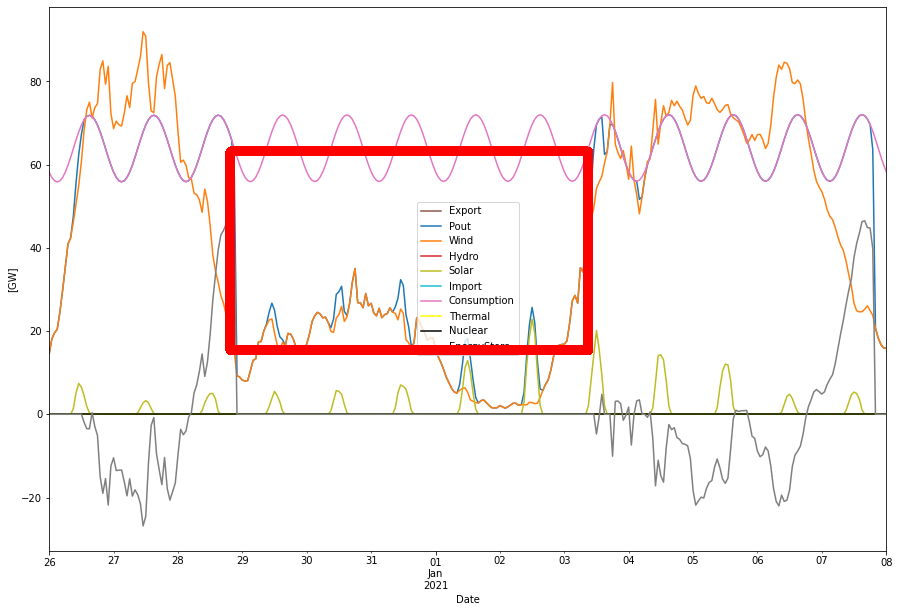
So with this weather pattern the 6.2 TWh battery is not enough to compensate for the low winds and absent sun in the mid-winter of 2020-2021. In the real world the deficit of 17.9 TWh out of 500 TWh is not so much and could be imported. However, with no base power generation, the deficit valleys can become very deep when there is no battery power left to compensate. We see that we have deficit valleys of up to 69 GW. This is what would be needed in import capacity in order to not get a black-out somewhere in Germany.
On the opposite side, in order to use all the “super-power” produced, for example for hydrogen generation, 204 GW of electrolyzers would be needed (then working at about 8% capacity factor, making the hydrogen expensive). With a more reasonable 50 GW electrolyzer capacity, 95 TWh of hydrogen could be produced, still only at 22% capacity factor, leaving about 52 TWh energy curtailed.
To avoid deficits during the mid-winter completely, around 40-45 TWh battery storage is needed which is of course unreasonably much. Consumer flexibility cannot compensate for the large deficit valleys that can occur when the battery store is empty and cannot contribute power.
What the simulation tells is that the extreme peaks and valleys you get in a pure SWB system of this size are really hard to handle!
Improvement 1: Hydrogen backup instead of batteries
With the same simulation, just exchanging the batteries to hydrogen production with electrolyzers, gas fired plants and hydrogen storage, we can utilize the high storage capacity of salt caverns in Gemany. Using a 40% roundtrip efficiency power-hydrogen-power (which is probably a too high number) we get the following system for a non-deficit condition
Supplied power per year:      500.13 TWh
Consumption per year:         500.34 TWh
Produced wind per year:       409.70 TWh
Produced solar per year:      228.45 TWh
Energystore in cap            205.00 GW
Energystore out cap            70.00 GW
Energystore storage cap    140000.00 GWh
Energystore In               -237.25 TWh
Energystore Out                99.22 TWh
Curtailed per year              0.00 TWh
Deficit per year                0.21 TWh
Max shortage:                  55.82 GW
Max overshot:                   0.00 GW
Import per year:                0.00 TWh
Export per year:                0.00 TWh
That is with 205 GW of electrolyzer capacity, 70 GW of hydrogen gas fired plants and 140 TWh of hydrogen storage it is possible to have a balanced system. No “super-power” is produced, the 130 TWh of additional production is all being consumed in the power-gas-power cycle.
With estimated cost of 500-1000 USD/kW of electrolyzer and gas turbine cost and 0.2 – 0.8 USD per kWh of salt cavern storage, the total cost would sum up to between 165 – 387 GUSD. The average 276 GUSD is actually higher than the battery cost for 6.2 TWh above (but lower than it would be for 40-45 TWh of batteries which this solution really should be compared to).
Improvement 2: Nuclear baseload power + SWB
In this alternative the 2022 levels of wind and solar power are kept and instead 45 GW of nuclear baseload capacity working with 89% capacity factor is built. Also in this alternative a battery storage would be unreasonably large, so the same solution as in Improvement 1 is used for storage, with the same cost numbers. A balanced 500 TWh would look like this:
Supplied power per year:      500.34 TWh
Consumption per year:         500.34 TWh
Produced wind per year:       125.00 TWh
Produced solar per year:       61.90 TWh
Produced nuclear per year:    351.56 TWh
Nuclear capacity factor:        89.06 %
Energystore in cap              60.00 GW
Energystore out cap             40.00 GW
Energystore storage cap     55000.00 GWh
Energystore In                -66.56 TWh
Energystore Out                28.44 TWh
Curtailed per year              0.00 TWh
Deficit per year               -0.00 TWh
Max shortage:                  -0.00 GW
Max overshot:                   0.00 GW
Import per year:                0.00 TWh
Export per year:                0.00 TWh
In this system we have todays level of wind and solar power, plus around 350 TWh nuclear baseload energy. A 55 TWh hydrogen store with 60 GW of electrolyzer and 40 GW of gas turbine capacity serves as back-up/balancing power.
Using the same numbers as above for the hydrogen back-up power and a span 2000-5000 USD per kW of nuclear power we get a total cost of the system that is
| Low | High | Low | High | |||||
|---|---|---|---|---|---|---|---|---|
| Nuclear | 2000 | 5000 | USD/kW | 45 | GW | 90 | 225 | GUSD |
| Electrolyzer | 500 | 1000 | USD/kW | 60 | GW | 30 | 60 | GUSD |
| H2 CCGT | 500 | 1000 | USD/kW | 40 | GW | 20 | 40 | GUSD |
| H2 Storage | 0.2 | 0.8 | USD/kWh | 55 | TWh | 11 | 44 | GUSD |
| Totals | 151 | 369 | GUSD |
If using average costs this sums up to a total of 260 GUSD which is 30% lower than the 367 GUSD of the original proposal (which is also way too low if battery costs for 40-45 TWh is used instead of 6.2 TWh). This system also really handles the deficits that occur mid-winter 2020-2021.
It is a balanced system with no overshoots or deficits and is arguably a much more stable system with less power peaks and valleys. It also provides network services such as inertia, that somehow must be handled with power electronics in a pure SWB system. Also with local nuclear production close to consumption centers, the need for built-out transmission should be much smaller.
Conclusion
So what have we learned from this exposé? Here are some conclusions
- The SWB model is really too simple to describe a real system. The lack of base load power sources and import/export make the system too extreme. The balancing energy stores becomes unreasonably big when taking account less than ideal weather variations.
- However the simplicity makes it interesting for an analysis of “principal differences” between for example the pure SWB system and a SWB system with nuclear base load power.
- In this analysis we found that a Nuclear power + SWB system serving 500 TWh is on average 30% cheaper than the RethinkX cost of 367 GUSD. And then the RethinkX cost is much underestimated when considering that the real storage needs are much larger than what is assumed in their model (and that the battery costs are probably much higher than their projections).
- The network build-out costs are not included in this nor RethinkX’s analysis. But it is clear that they will be massively higher in the SWB system that is very distributed and have very large peak power. The balanced mix nuclear + SWB needs a much smaller bulid-out since nuclear can be built close to the consumption centers.
- Hence a balanced mix of nuclear + SWB is much more optimal then and SWB solution alone.