
Bengt J. Olsson
Twitter: @bengtxyz
LinkedIn: beos
SWETH system
SWENTH system
Discussion
Conclusions
Update 2023-07-08
Modeling a fossil free German power system
Inspired by the RethinkX SWB (Solar, Wind and Batteries) model (see this blog post), a more realistic model for Germany, with 500 TWh of consumption, is presented here. The model is based on either of these two alternatives
| SWETH | Solar, Wind, Eco, Thermal power and a balancing Hydrogen Store |
| SWENTH | Solar, Wind, Eco, Nuclear, Thermal power and a balancing Hydrogen Store |
The model also specifies self-sufficiency with respect to power delivery and hence no import is allowed. This condition will be discussed in more detail later. Given the production capacities, a simplified approach to estimate the total LCOE of the SWETH/SWENTH systems is performed.
“Eco, Thermal” is shorthand for hydro, bio, waste, geothermal and other small power sources that are likely to prevail also in a future scenario with more solar and wind power. Together these produce fairly constant base load power of 8 GW (see for example energy-charts).
Also instead of a battery storage system, a more realistic hydrogen store system is used together with the needed electrolyzers and hydrogen CCGT generation plants. We will assume that a generous 40% efficiency can be obtained in the power-H2-power cycle. Germany have an infrastructure for gas storage that may be converted for hydrogen, and also the possibility to create more hydrogen salt cavern storage. Batteries will not be included in this model since they can’t really balance wind and solar power from an energy perspective but rather provide high capacity for short times (and thus handle power spikes but not prolonged energy deficits).
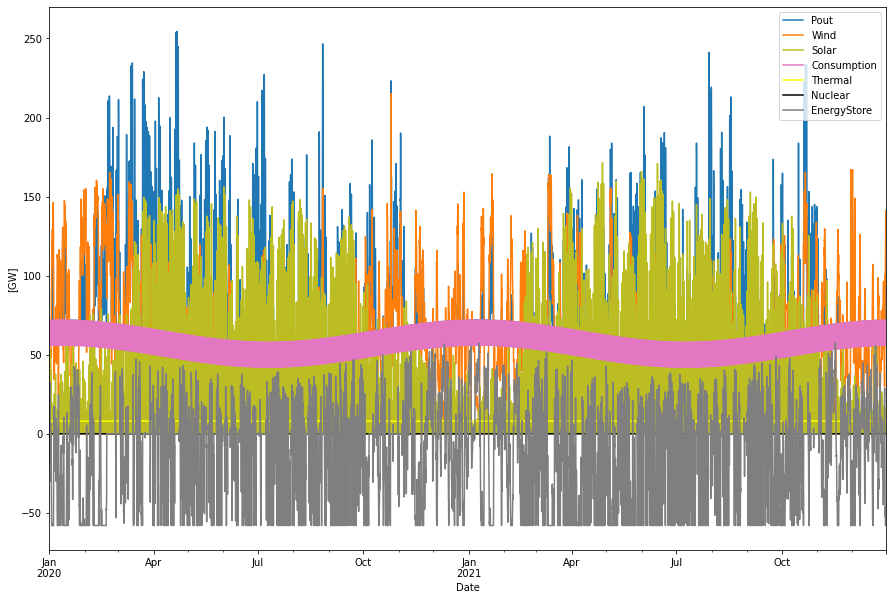
Another difference from the SWB analysis in the former blog post is that we here use actual wind and solar power data from Germany 2020 – 2021 instead of using the same from Denmark. It will give the same features but provides a somewhat more even power production, which can be seen in that a somewhat smaller storage to cope with the mid-winter between 2020 and 2021 is needed. Anyway, it is now German data.
A balance model approach is used for the simulation. The model is described here, but significantly updated since then, see for example here.
SWETH system
Balance in SWETH scenario
Here is a balanced scenario for Germany with 500 TWh power consumption with no import dependence.
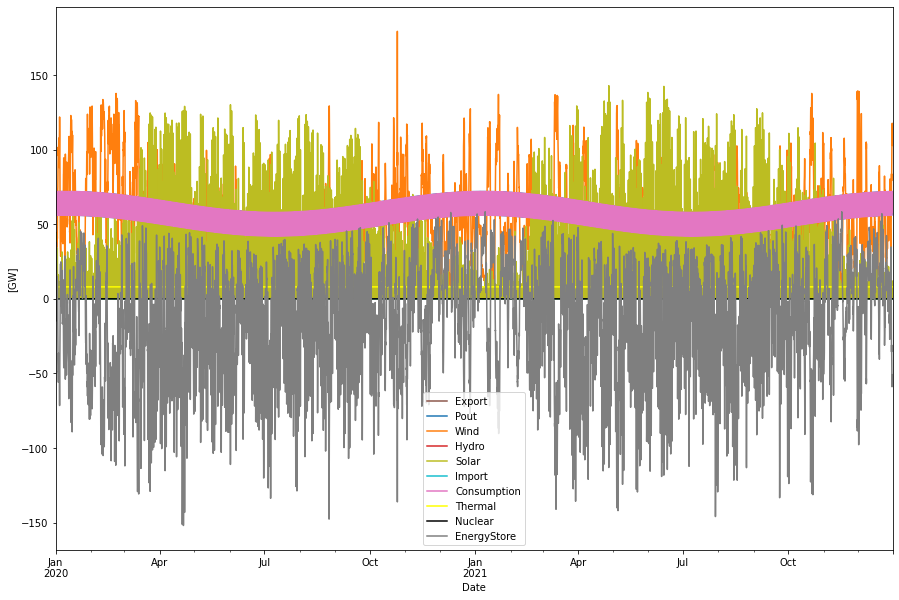
Consumption per year:         500.34 TWh
Produced hydro/therm per year: 70.17 TWh
Produced wind per year:       365.01 TWh
Produced solar per year:      182.52 TWh
Energystore in cap            152.00 GW
Energystore out cap            60.00 GW
Energystore storage cap    100000.00 GWh
Energystore In               -195.93 TWh
Energystore Out                78.55 TWh
Curtailed per year              0.00 TWh
Deficit per year                0.00 TWh
Max shortage:                   0.00 GW
Max overshot:                   0.14 GW
Import per year:                0.00 TWh
Export per year:                0.00 TWh
Energy balance from table above:
Produced power: 70 + 365 + 182.5 + 78.5 = 696 TWh
Consumed power: 500 + 196 = 696 TWh
It is seen that the system is in balance and with no import or export. There is a slight over-shoot of 0.14 GW which would disappear if the electrolyzer capacity is raised with this number.
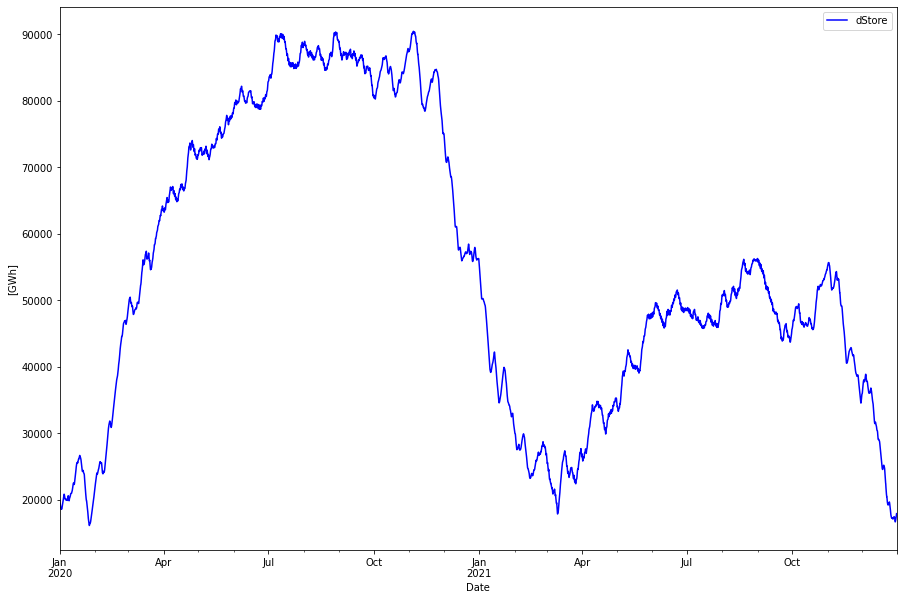
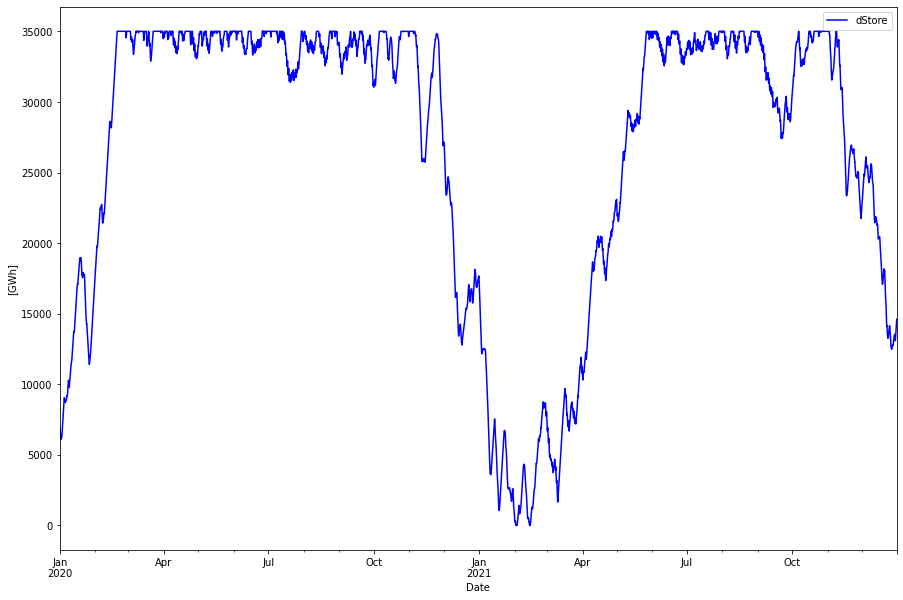
With 40% efficiency in the power-gas-power cycle we lose 117.5 TWh. The fill level of the H2 store, starting and ending at about 20 TWh look like this.
The electrolyzer capacity is 152 GW. It is used to produce 196 TWh hydrogen (measured as input energy) which gives a capacity utilization of 15% for the electrolyzers. 60 GW of hydrogen CCGT provides power in deficit situations. The 60 GW closely corresponds to the maximum consumption minus the 8 GW base load power that is always there.
LCOE for SWETH system
With all power numbers specified we can attempt to provide an LCOE estimate of the system. In this simplified approach it is calculated as
LCOE = NPV(CAPEX+OPEX) [USD] / NPV(Generation) [kWh]
LCOE is of course subject to a number of parameters that have to be estimated or chosen and hence a rather subjective measure. Below is given an estimation for CAPEX and OPEX costs for the various parts. The estimations are quite optimistic. For wind power half of the capacity comes from off-shore and the other half from on-shore. The off-shore part push up the costs significantly. The combined utilization factor has been set to 37.5% (average between 25% for on-shore and 50% for off-shore). Solar/PV efficiency is assumed to be 12%.
| Item | CAPEX [GUSD/GW] | CAPEX [GUSD] | OPEX [GUSD/y] |
|---|---|---|---|
| Wind power | 2 | 222 | 6.7 |
| PV/solar power | 0.8 | 139 | 2.6 |
| Eco + Thermal | 2 | 20 | 2.5 |
| H2 CCGT | 0.75 | 45 | 0.9 |
| H2 Storage | 0.5 [GUSD/TWh] | 50 | 1.0 |
| Electrolyzers | 0.75 | 114 | 2.8 |
| Total | 590 | 16.5 |
Maintenance and Operation costs (OPEX) are gathered from different sources. Typically expressed as a cost per KW installed power per year, but sometimes as cost per kWh produced. For Eco + Thermal it is mainly the cost of biomass that drives the OPEX.
Now in this simplified model CAPEX is spent “overnight” and OPEX is per year during the lifetime of the system, which is here chosen to be 25 years. The discount rate is chosen to 6%. The system produces the same 500 TWh energy each year.
With these numbers a system LCOE is 0.118 USD/kWh is obtained.
SWENTH system
In a SWENTH system where nuclear has been added offsetting wind and solar, also the balancing hydrogen store costs are lowered. Let’s investigate by how much!
Balance in a SWENTH system
In the SWENTH system, todays (2022) levels of wind and solar power are kept, and nuclear power is installed in an amount to balance the consumption together with the other power sources. Nuclear power is here modelled with 37 x 1 GW nuclear reactors. These are must-run sources (i.e. not load following) with simulated downtimes due to both failures and maintenance (the latter through the summer months). In this particular simulation they have a 88.9% capacity factor.
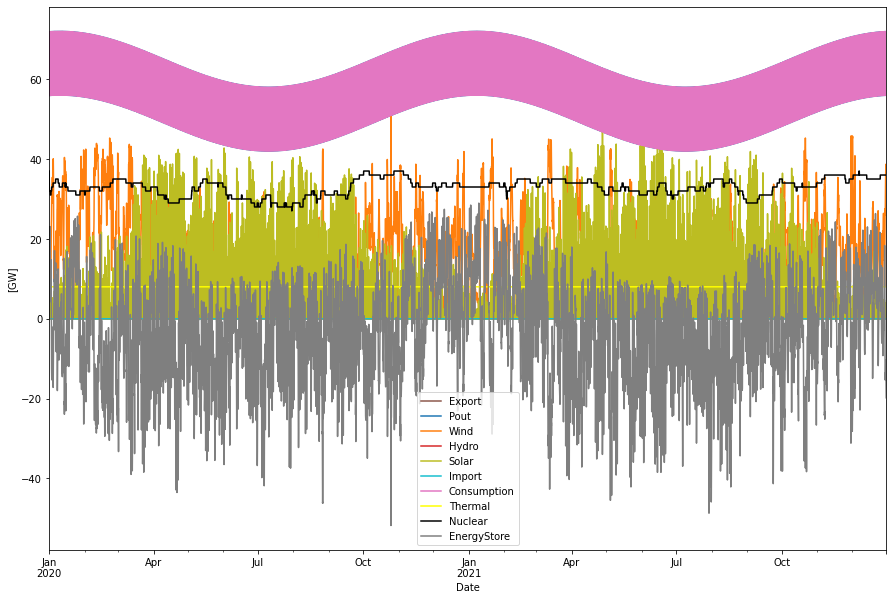
Consumption per year:         500.34 TWh
Produced hydro/therm per year: 70.17 TWh
Produced wind per year:       120.00 TWh
Produced solar per year:       60.01 TWh
Produced nuclear per year:    288.60 TWh
Nuclear capacity factor:        88.92 %
Energystore in cap:            52.00 GW
Energystore out cap:           29.00 GW
Energystore storage cap     50000.00 GWh
Energystore In                -64.43 TWh
Energystore Out                25.98 TWh
Curtailed per year              0.00 TWh
Deficit per year               -0.00 TWh
Max shortage:                  -0.00 GW
Max overshot:                   0.00 GW
Import per year:                0.00 TWh
Export per year:                0.00 TWh
Energy balance from table above:
Produced power: 70 + 120 + 60 + 288.5 + 26 = 564.5 TWh
Consumed power: 500 + 64.5 = 564.5 TWh
We can also see that the maximum span peak overshot to peak deficit (without electrolyzers and CCGT) is 52 + 29 = 81 GW which is much smaller than the corresponding 212 GW in the SWETH case. The SWENTH system therefore handles much nicer with smaller power swings.
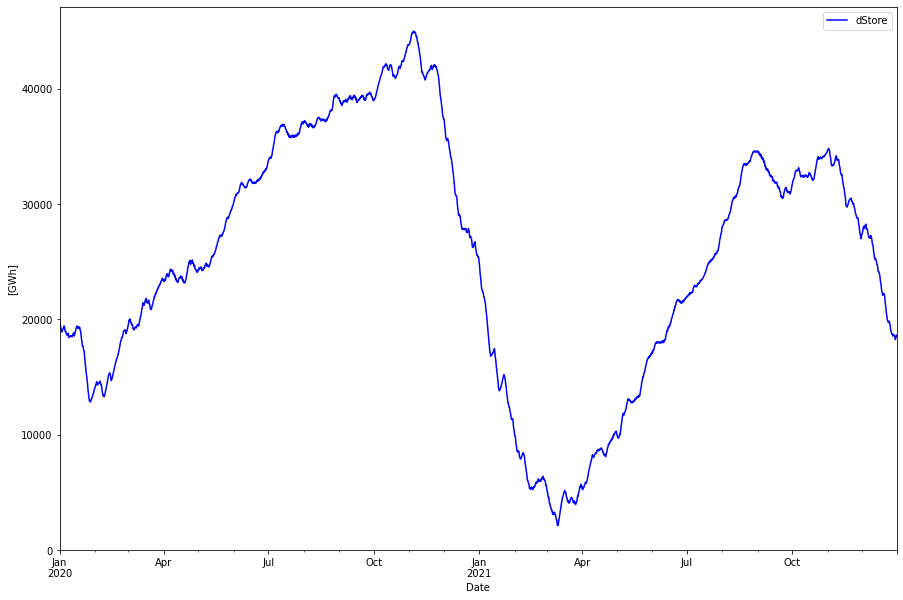
With smaller power swings lesser electrolyzer and CCGT capacity is also needed, 52 and 29 GW respectively. The size of the hydrogen store becomes 50 TWh instead of 100 TWh.
LCOE for SWENTH system
Using the same CAPEX and OPEX costs as for the SWETH case but adding nuclear (and subtracting wind/solar/storage) we obtain the following table:
| Item | CAPEX [GUSD/GW] | CAPEX [GUSD] | OPEX [GUSD/y] |
|---|---|---|---|
| Wind power | 2 | 73 | 2.2 |
| PV/solar power | 0.8 | 46 | 0.9 |
| Eco + Thermal | 2 | 20 | 2.5 |
| H2 CCGT | 0.75 | 22 | 0.5 |
| H2 Storage | 0.5 [GUSD/TWh] | 25 | 0.5 |
| Electrolyzers | 0.75 | 39 | 1.0 |
| Nuclear | 5 | 185 | 8.4 |
| Total | 409 | 15.9 |
Using the same calculation (that is also assuming a life time of the nuclear to be only 25 years) we obtain a system LCOE of 0.090 USD / kWh for the SWENTH system. This is almost 24% lower than the pure SWETH system. Both CAPEX and OPEX numbers are lower with the SWENTH system.
A 50 year estimate is performed by adding a “replacement cost” corresponding to half the CAPEX cost of all components with a 25 year life span (Eco and Thermal exempted) at year 26 and the run the LCOE calculation over 50 years. Then the following LCOE numbers are obtained:
- System LCOE for SWETH, 50 years: 0.110 USD/kWh
- System LCOE for SWENTH, 50 years: 0.082 USD/kWh
giving an even larger 25% price difference.
Discussion
Model
The SWETH/SWENTH models provides valuable insight to the system costs of providing power with either a rich solar/wind power system (SWETH) or a nuclear rich system (SWENTH). Since only one balancing source is included (the hydrogen store) there are no “degrees of freedom” to consider, and hence no need to use a complex market pricing model. Since no import/export is allowed in the model, there is no need to chose if for example a deficit shall be balanced with the hydrogen store or with import power, a choice that would depend on the price of stored power vs import power. This is of course also a weakness since import power could be cheaper than the stored power and hence lower the total cost.
On the flip side, this condition automatically ensures security of supply, since there is no dependence of import, a security that possibly could be worth the extra cost.
Import
Also import becomes complicated, especially in the SWETH model, since it has such large power swings. If the hydrogen store goes empty, import must have the same capacity as the CCGT generation capacity in the model in order to not get a power deficit (or “black-out”). In the SWETH simulation above, this capacity is 60 GW which is a considerable interconnect capacity. But why bother about this import capacity if it is not needed? Well, imagine that the weather pattern is slightly worse than the 2020-2021 weather pattern above, we could very well hit the bottom of the hydrogen store level and then need to import. Such a case is depicted below were a smaller hydogen storage (70 TWh) is simulated. When the storage runs empty there is no CCGT capacity for balancing. Even though the import amount is low (0.75 TWh during this two days) the import capacity must be at least 53 GW to not get a deficit. This gives a utilization factor of only 0.16% of the import capacity.
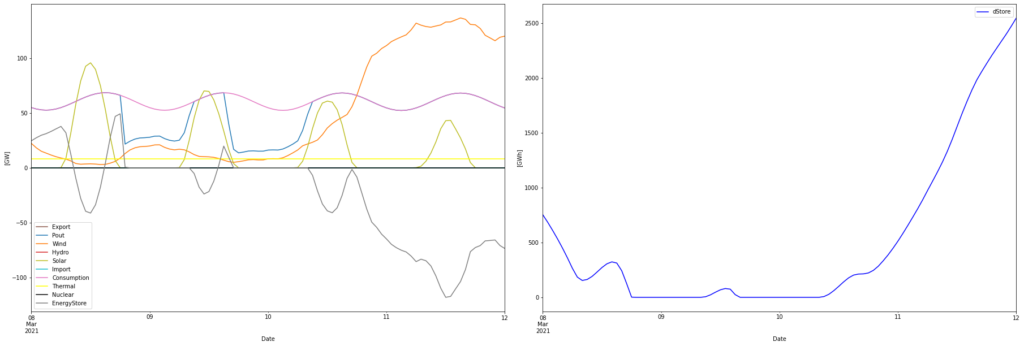
The alternative is to design the hydrogen store with such margins that it would never go empty (and CCGT capacities to cover all possible deficit situations). This will increase the cost and complexity significantly.
Pure ENTH system
This problem is also prevalent in the SWENTH model but to a much lower degree due to the lower power swings in the system. In fact a “ENTH” system can be designed without any solar/wind power at all, with a hydrogen store system that balances only the variability of consumption plus the variability in nuclear power production that is due to failures and maintenance. In this simulation such a system would require about 21 GW of electrolyzers, 14 GW of CCGT and 30 TWh of storage, and actually provide a slightly lower LCOE than the SWENTH system. It would be possible to have an even smaller hydrogen storage if the nuclear power plants were load following (following the yearly variations) but then also an over-capacity of nuclear is needed so it is not clear which is most cost effective.
Transmission network
Another important aspect that makes a huge difference in the two cases is the transmission network needs. They are not quantified in this model but it is very clear that the network costs for the SWETH system is much higher than for the SWENTH system. This is due to two factors that works in disadvantage for the SWETH system
- Geographical dispersion. The SWETH system with its high degree of wind and solar power will require a much more dispersed transmission network. For example expensive submarine cables to the offshore wind power farms. Contrary, in the SWENTH case, the nuclear plants could be built close to consumption centers with much smaller transmission needs.
- Peak power requirements. Due to the strong power variations in the SWETH case, the transmission capacities must be much higher than in the SWENTH case. This means that the utilization of the transmission resources will be lower and hence costlier. To some extent this can be avoided by having the storage and hydrogen production/generation facilities at the right places, but the options for these are more limited due to the geological conditions for salt caverns.
Both these factors will contribute to increase the already large system LCOE difference between the two systems.
System services
The SWENTH system also provides system services, such as inertia, to a much higher degree than the SWETH system which has to rely on more volatile and fragile power electronics plus software for this.
Conclusions
A balance model approach, with no import or export allowed has been used to compare two power system approaches for Germany. Both systems provides 500 TWh of fossil free power per year. One system (SWETH) is based mainly on renewable power (that is wind and solar) and the other system (SWENTH) uses nuclear as the major power source. Both systems uses a hydrogen storage system with electrolyzers to consume overproduction of power and hydrogen CCGT as backup when the other power sources can’t supply the demanded power.
A simplified LCOE approach is used to estimate the system LCOE of the produced energy. Even though the absolute LCOE is quite subjective and dependent on the choice of parameters, the difference in system LCOE should be less subjective.
The result is that the SWENTH (nuclear based) system have a system LCOE that is 23-26% lower than the system LCOE for the SWETH (only wind/solar power) system.
This difference is further enlarged if considering the much higher transmission network costs for the SWETH system.
If import should be considered, the SWETH system requires much higher interconnect capacities to not get a deficit (or “black-out”) if the hydrogen store runs empty.
The simulation is based on German solar and wind power production from 2020-2021. These two years are just a sample of possible weather years. There have been better years, but certainly also worser years. Hence the SWETH capacity numbers should be considered as minimum values.
It is hard to understand why Germany do not consider a SWENTH system that is superior to a SWETH system, both with respect to its characteristics and features as well as to its economic performance.
Update 2023-07-08
The previous analysis is based on a “balanced approach” that is, all power produced is consumed and there is no curtailment. Some energy is lost in the power-hydrogen-power cycle but that is not curtailed power. However, this may not be the most optimal system solution. By producing more power than is consumed, less storage will be used. If this is optimal from a system LCOE point of view depends on if the increased cost of the additional wind/solar power sources is matched by a corresponding or larger saving in the cost of storage + generation. This will depend on the assumptions on the cost for the various components. Here all overproduction increased the LCOE. Possibly because the 50/50 mix of onshore and offshore wind assumed. With more onshore wind and less offshore the contribution from wind power to the system LCOE would be lower and hence some optimal over-production could be found.
But let’s take a look were we add 20% more solar and wind power than in the SWETH scenario above. Correspondingly storage and electrolyzer resources are removed until we get a deficit of less than 0.5 TWh per year. This corresponds to a loss of less than 1 promille and is used just to “shave off” outliers, especially in the storage size.
Such a system is shown below
Consumption per year:         500.34 TWh
Produced hydro per year:        0.00 TWh
Produced thermal per year:     70.17 TWh
Produced wind per year:       438.01 TWh
Produced solar per year:      219.02 TWh
Energystore in/out cap         58.00 GW
Energystore storage cap     35000.00 GWh
Energystore In               -156.66 TWh
Energystore Out                60.88 TWh
Curtailed per year            131.46 TWh
Deficit per year                0.36 TWh
Max shortage:                  38.10 GW
Max overshot:                 193.23 GW
Curtailment in this case is about 130 TWh so it is close to the SWB scenario of RethinkX. The electrolyzer capacity has been chosen to the same size as the CCGT generation capacity, 58 GW. Increasing the capacity from this value gives a small decrease of the storage size, but induces high costs.
The storage size in this case becomes about 35 TWh and have a look as follows.
In this case the storage needs decreases from a about 18-20% to 6-7% of the total consumption.
To decrease the storage size to about 1% (here 5 TWh) we would need to approximately double the capacity of the solar/wind power from the original values and we would curtail 620 TWh… This does not seem reasonable.
For 50% overproduction of solar/win power the storage size became 12.5 GWh or 2.5% of the consumption. Maybe a more reasonable overproduction. By utilizing more electrolyzer capacity some of this overproduction could be used to produce hydrogen for industrial processes.