
Bengt J. Olsson
Twitter: @bengtxyz
The original blog post on modelling and simulating a future Swedish power system describes a balance model and its application on a scenario depicted by Svenska Kraftnät, the Swedish TSO. Please refer to that blog post for an understanding of the model. In this blog post we will look at the same scenario, but now with some important updates to the model.
- The hydro power model is changed to incorporate the contribution from Norway’s hydro power.
- Solar (PV) power is included, modeled on statistics from Denmark 2020-2021
- The energy deficit model now calculates the actual input and output from a finite size store
- Consumption flexibility is included
These are significant changes so it is interesting to see the effect of these, but the main conclusions of the original blog posts are still valid.
A smaller change is introduction of a schematic day/night consumption variation. It is made by overlaying a sinus curve with 2.5 GW amplitude and with max/min at 15:00/03:00 respectively. Does really not change the results much but gives a more visually closer resemblance of the real consumption curves. Let’s look at the larger changes in more detail.
Hydro power model
The original post models Sweden’s hydro power as a perfect power source capable of producing 2-13 GW of power to balance the must-run sources and consumption, without considering the actual store levels in water reservoirs. Instead, an iterative approach is used to adjust the must-run and/or consumption parameters until the desired amount of hydro power is produced, typically 67 TWh per year, which is the average production volume.
However, in practice, the use of Swedish hydro is mixed with hydro import from Norway in a way that is difficult to model accurately. To account for this, a new approach is used: Sweden’s 3 GW import capacity from Norway and average annual import of 7 TWh are factored into a new hydro model that considers a power source with an output of 2-16 GW, delivering an average of 74 TWh per year.
To validate the hydro power model, data from the ENTSO-E transparency platform for 2020-2021 was used, with hourly physical flow import from Norway to Sweden added to the Swedish hydro power production. The resulting production graph was obtained.
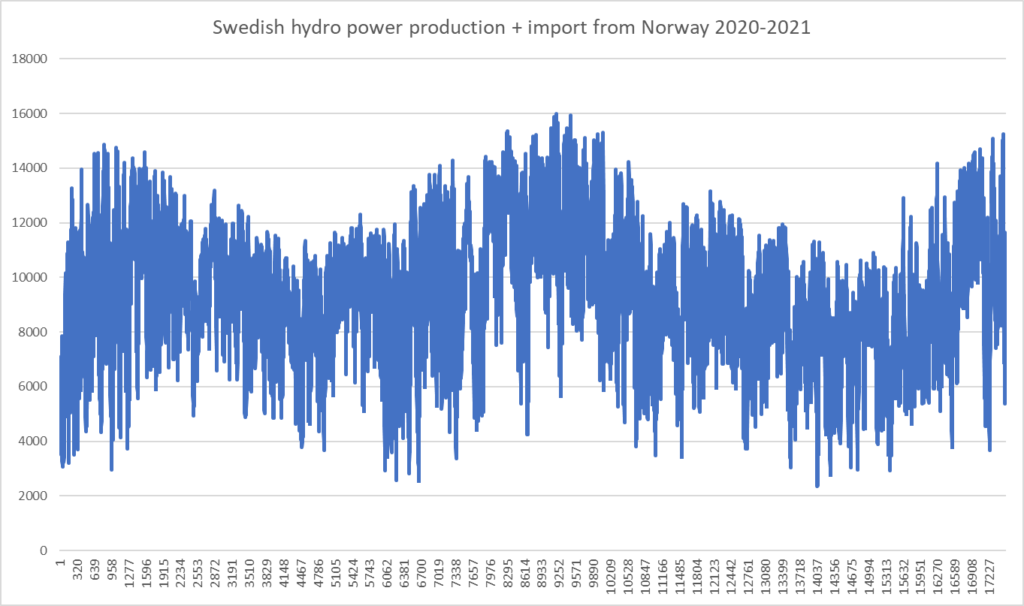
It resembles quite well what we would expect from a hydro power source 2 – 16 GW. Using this model we get very good agreement with a power system model for Sweden 2020-2021 where we have actual data to compare with.
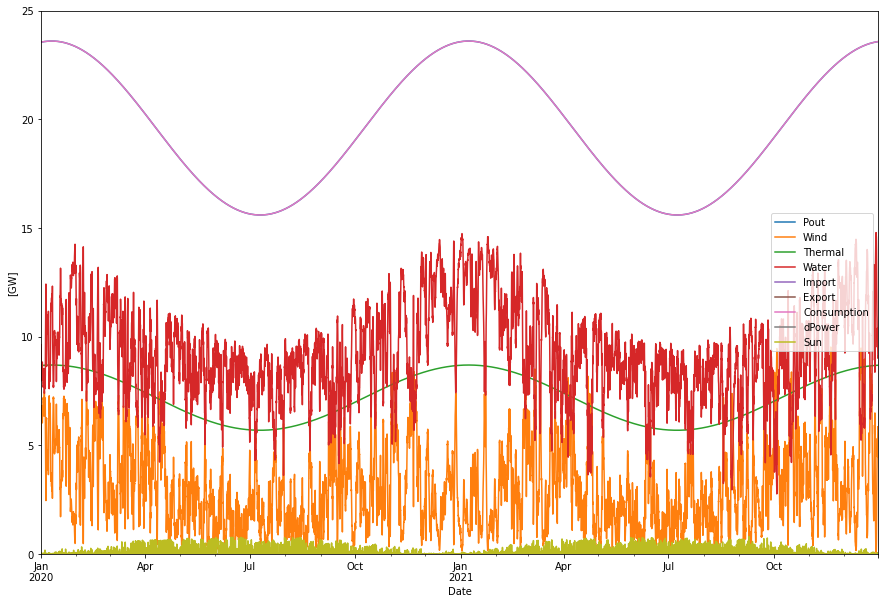
Supplied power per year:      172.11 TWh
Consumption per year:         172.11 TWh
Produced hydro per year:       80.37 TWh
Produced wind per year:        27.53 TWh
Produced sun per year:          0.99 TWh
Produced nuc/bio per year:     63.23 TWh
The numbers obtained from the hydro model are very similar to the official statistics provided, and the hydro energy production figure takes into account approximately 9 TWh of imports from Norway, while the consumption figure includes exports.
To accurately capture the majority of Swedish power imports, this hydro model incorporates a smaller value for the import limit in the balance model, typically 1 GW, which represents imports from countries other than Norway. Although the import capacity is higher, a conservative estimate is used due to the uncertain future of obtaining necessary imports, particularly in a scenario with variable wind and solar power in surrounding countries. The import limit can be modified to explore potential deficit situations with or without imports.
Solar power
Solar power is included in the same way as wind power. It is modeled as must run source and the statistics is taken from Danish solar power 2020-2021 since Swedish values was not present in ENTSO-E for that period. Anyway since southern Sweden is approximately on the same latitude as Denmark, we can expect a similar distribution for Sweden as well. The 2021 values are normalized to produce the same total energy as 2020. Then the complete curve for 2020-2021 can be scaled to produce the required output. In the SvK EF scenario 2045 the amount of solar power is 18 TWh, which seems reasonable, and the same value is kept in this model. So in fact, in order to have a balanced system providing 74 TWh of hydro power, only the wind power scale parameter is adjusted.
Deficit store
The model now has a finite size deficit store. When balance cannot be achieved between production and consumption (including import and export) power must be either curtailed, or a deficit of power occur. Curtailment is of course not good, but does not really harm except from that energy is wasted. But a deficit is problematic and should be avoided at all costs. So for this reason we have spare power in form of a deficit store in the model. This store is filled with at a certain rate (until the store is full) and emptied as needed, also with a certain max rate out while the store is not empty.
Note that energy in and out of the store is not symmetric. If the power->storage->power efficiency is η then
1 GW in => 1 GWh in to energy storage per hour
1 GW out => 1 GWh / η out of energy storage per hour
For example if we have a hydrogen store with a round trip efficiency η = 40% then 1 GW out during one hour corresponds to 2.5 GWh in to the store.
Consumption flexibility
Consumption flexibility, defined as lowering the consumption up to X percent when needed, can be added. It is hence a dispatchable flexibility source that is dispatched partly after hydrogen production flexibility and before import, and partly after import. This flexibility is not time limited, it will be dispatched as long as it is needed. The mechanism can hence be described as a kind of price elasticity, i.e. consumption will go down due to the sharply increased prices in a deficit situation. Typically we will assume the flexibility to be 5%.
Simulation
Wind/Solar power scenario, no nuclear.
Power production
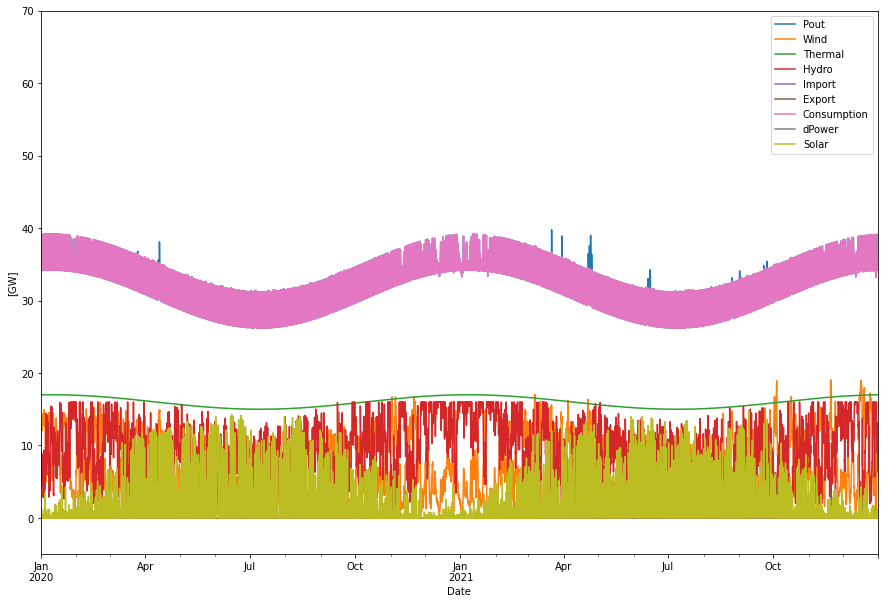
Here is the output from a simulation of the SvK EF scenario.
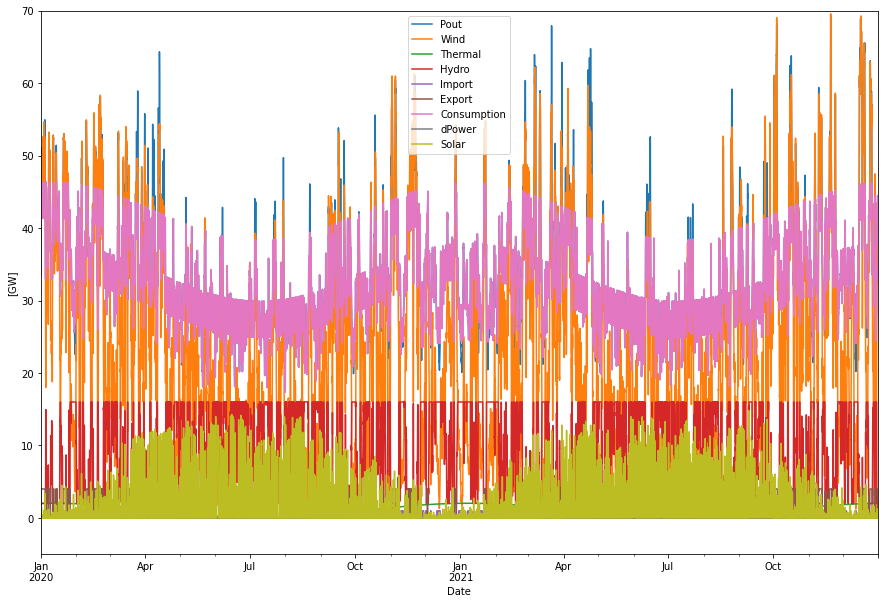
Supplied power per year:      302.19 TWh
Consumption per year:         286.39 TWh
Produced hydro per year:       73.81 TWh
Produced wind per year:       200.95 TWh
Produced solar per year:       18.02 TWh
Produced nuc/bio per year:      9.08 TWh
H2 production per year:        84.89 TWh
- From excess power:           20.63 TWh
- Within consump. profile:     64.25 TWh
Cap. util. electrolyzers:      57.34 %
Curtailed per year             10.25 TWh
Deficit per year                0.75 TWh
Max shortage:                   8.70 GW
Max overshot:                  27.32 GW
Import per year:                0.33 TWh
Export per year:                6.29 TWh
If compared with Figure 1 of the original post, it can be seen that the SvK and this model agree quite well. The main difference is the 74 vs 66 TWh hydro produced and a corresponding 10 TWh less wind power with this model.
Features of this scenario are strong power peaks, up to 70 GW, which means that some energy is going to be curtailed. The amount of curtailment is dependent on the chosen export capacity. Here we have set the export limit to the same as the import limit, that is 4 GW. With a higher export limit we get more export and less curtailment.
The deficit after maximum hydrogen production flexibility in this model will depend on the assumed import capacity. The value above, 0.75 TWh, is obtained for an assumed import capacity of 1 GW (that is, on top of the 3 GW / 7 TWh Norwegian import that is included in the hydro power model). So a deficit between 0 and 1 TWh can be expected depending on the import assumptions. In order to get the deficit down to 0.04 TWh per year as in the SvK model, the import capacity must be set to 10 GW ( 3 GW from Norway and 7 GW from other countries).
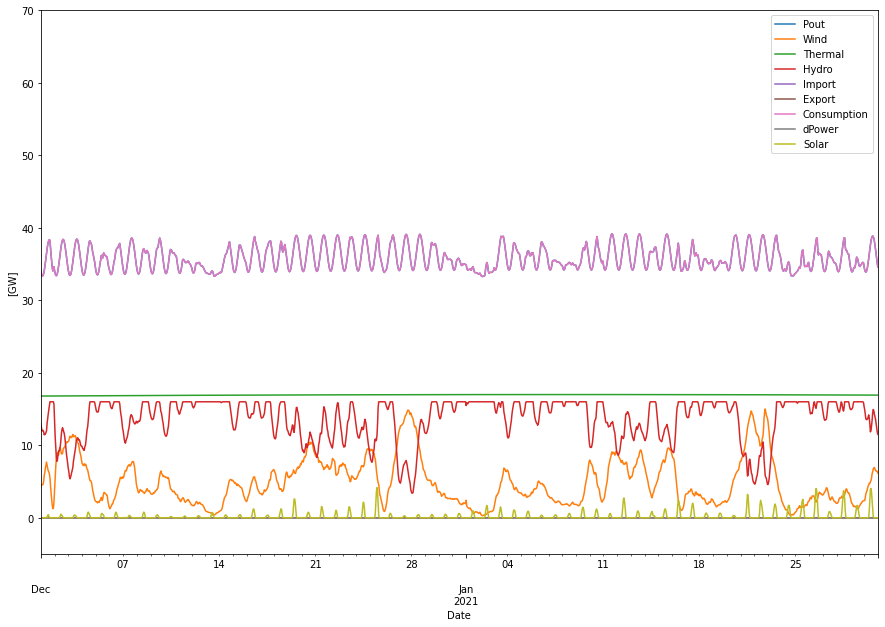
A closer look at the deficits is given by expanding the graph around Dec 2020 to Jan 2021.
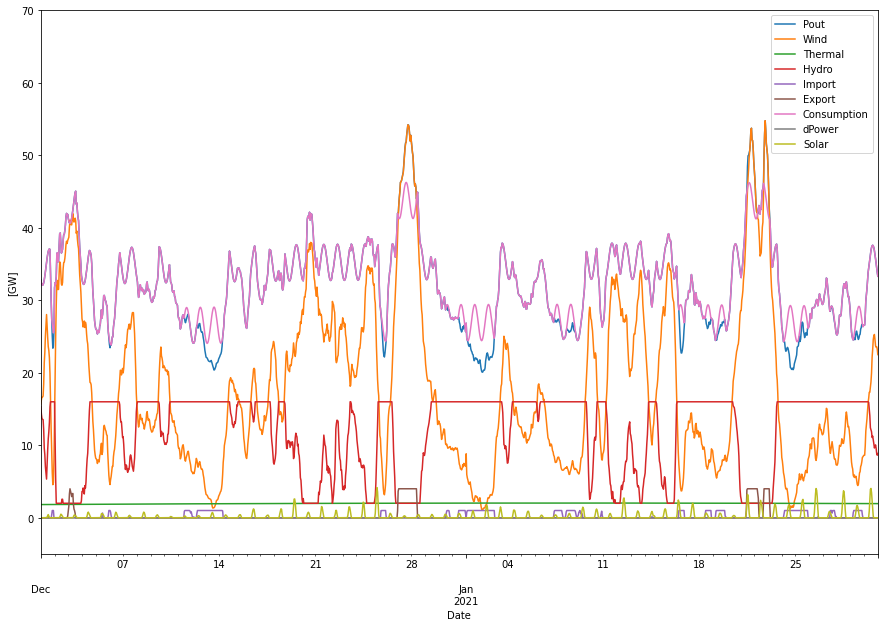
As can be seen the hydro power is fluctuating between max and min power dispatch to balance the variations in wind. We can also see that the hydrogen production is flexible and is not producing during wind lulls.
Let’s assume that we have 40 GWh of distributed battery storage available (from home or V2G batteries) that can supply 20 GW of power during these deficits. This could for example be from 2 million homes with cars, each with 20 kWh (home+car batteries) available capacity, and with 10 kW access.
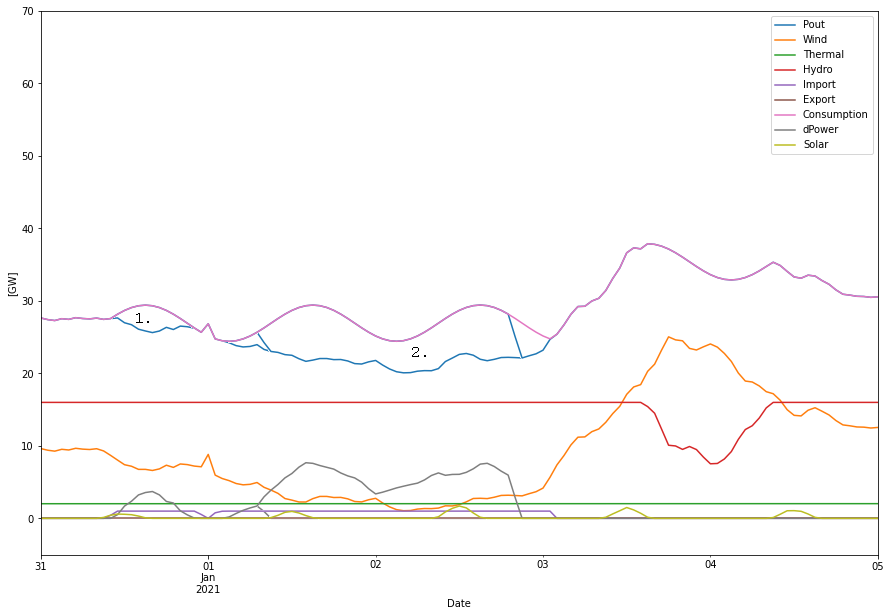
This battery store would only remove the area denoted as 1. in the figure above. That is, there would still be about 36 hours of deficits after the battery backup is depleted. To (almost) fully remove the deficit, i.e. both areas 1. + 2., a battery capacity of 300 GWh is needed.
To remove the same deficit with a hydrogen gas turbine (35% roundtrip efficiency) a 8 GW turbine/generator is needed and a hydrogen store size of almost 1 TWh.
A positive aspect of the battery backup is that it provides a very high capacity in terms of instant power due to the distributed nature of many smaller sources, while the hydrogen gas turbine capacity must really be designed to meet the power deficit magnitude. On the other hand almost 10 times the estimated available battery storage capacity was needed to remove the deficit.
With consumption flexibility
Up to here we have only considered hydrogen production flexibility which is the first flexibility to be dispatched. We will now also consider a 5% consumption flexibility, that is the overall consumption is lowered up to 5% in order to balance the low available power in a deficit situation. 5% is considered to be a rather strong flexibility during the winter when the deficits occur.
The consumption flexibility lowers the battery capacity need, but as can be seen in the figure below, there is still a need of 5 times more than the anticipated 40 GWh, that is 200 GWh battery capacity is needed with this weather pattern to (almost) avoid deficits or black-outs.
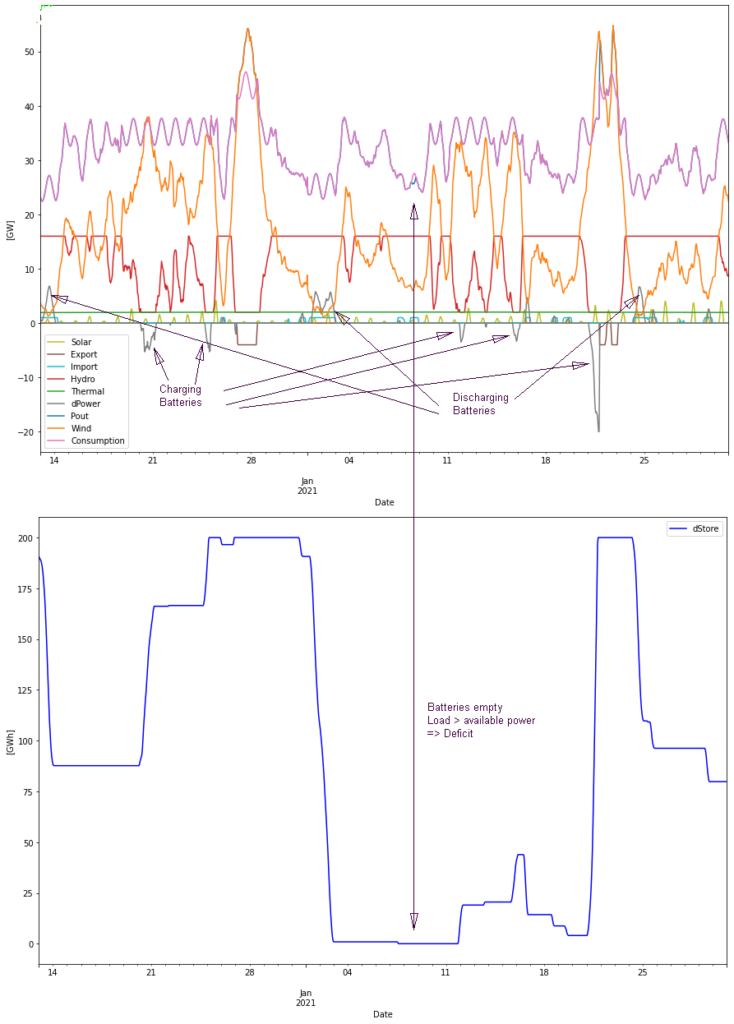
In this scenario thus 200 – 400 GWh of battery storage is needed to avoid black-outs. This is an considerable amount of battery storage.
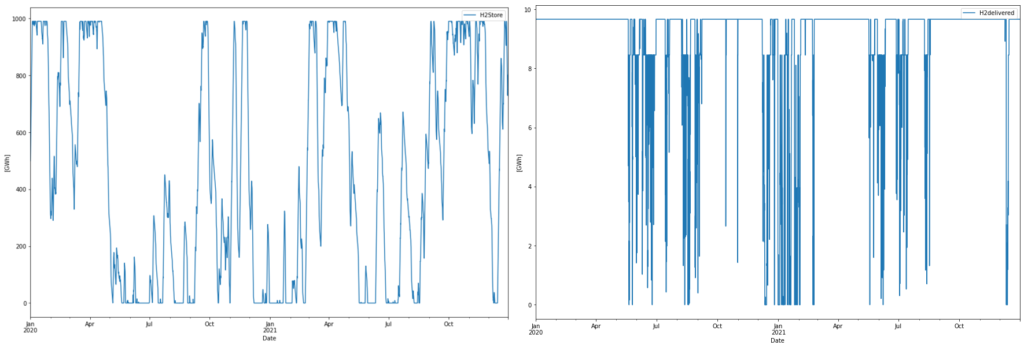
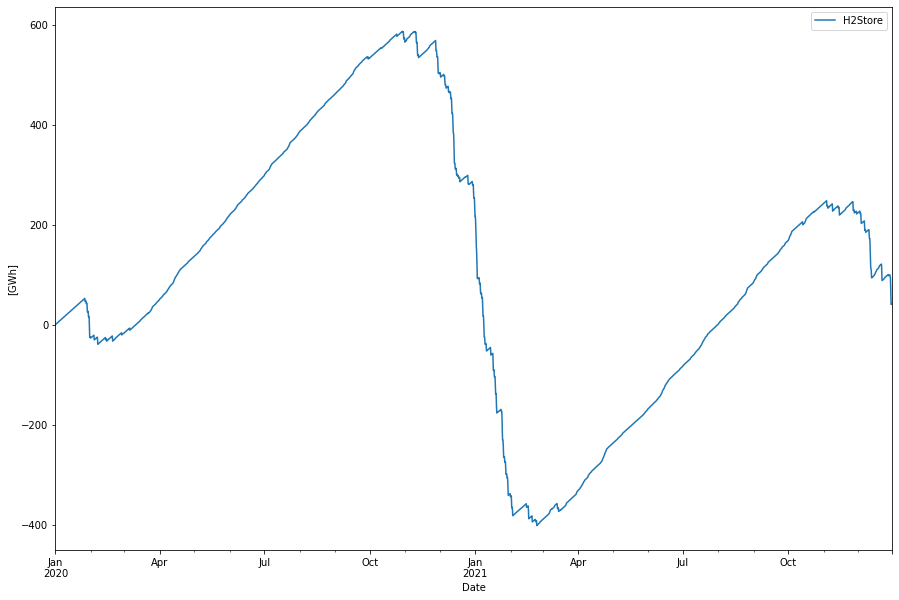
Hydrogen production
Hydrogen production will vary with the available wind energy. The electrolysis capacity is 16.9 GW and is utilized to 57%. Compared to the older simulation without solar power, the variation in hydrogen production is somewhat smaller. This is mainly attributed to the fact that the introduction of 18 TWh of solar power offsets a similar amount of wind power giving an overall slightly smoother power delivery (which can be seen by comparing the wind power peaks in this simulation vs the original).
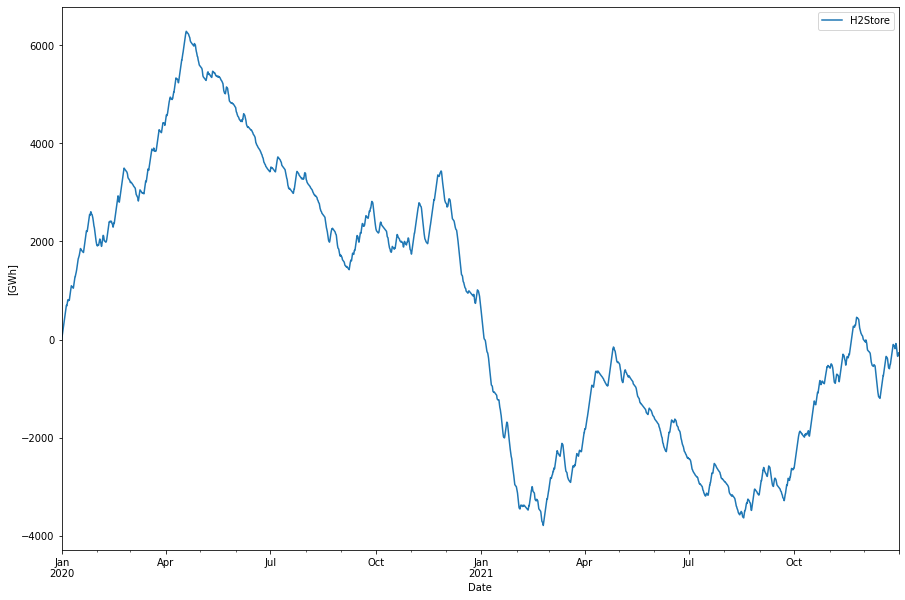
As we can see we need a 10 TWh store to be able to have a constant 8 GW output from the store. In a Swedish context this is extremly large. The variation in production is both due to the varying energy production and its role as flexible consumer, i.e. production is throttled down to achieve balance in when wind/solar power is low.
It is however unlikely to build 10 TWh of hydrogen storage in Sweden, more likely to build maybe 0.5 – 1 TWh. This will have an impact on how much hydrogen that actually can be delivered to the industry. Also if we consider a sector coupling and uses this store for power system deficits, we could see in the example above that possibly whole this TWh size store would be needed at times only for power balancing.
Nuclear alternative
In this alternative the heavy build-out of wind power is avoided and instead replaced by a nuclear power build-out. We assume the same amount of solar as well as thermal power as in the non-nuclear case. We also assume that the present nuclear power plants (~5 GW) have a pro-longed life time an still contribute in this scenario.
Supplied power per year:      287.86 TWh
Consumption per year:         286.13 TWh
Produced hydro per year:       74.39 TWh
Produced wind per year:        55.06 TWh
Produced solar per year:       18.02 TWh
Produced nuc/bio per year:    140.40 TWh
H2 production per year:        85.23 TWh
- From excess power:            0.16 TWh
- Within consump. profile:     85.08 TWh
Cap. util. electrolyzers:      97.30 %
Curtailed per year              0.09 TWh
Deficit per year               -0.00 TWh
Max shortage:                  -0.00 GW
Max overshot:                   5.91 GW
Import per year:                0.00 TWh
Export per year:                1.64 TWh
In this scenario we have the same 18 TWh of solar, but only 55 TWh of wind energy yearly. According to the Swedish Wind Power association we will reach these levels already before 2030. The big difference is the 140 TWh of Nuclear/Thermal. if about 60 of these belongs to the present capacity (about 50 TWh nuclear + 10 TWh thermal today) means 80 TWh or 9 GW new nuclear capacity, or 10 GW including a 90% capacity factor.
There are no deficits and no import need (other than the Norwegian hydro that is included in the hydro model). Almost no curtailment and a small export. Peak power for any power source is below 20 GW and hence make network capacity planning simpler.
Even here we see a maximum dispatch of hydro power at long times, but not at all the frequent min/max fluctuations we had in the wind scenario.
Hydrogen production
In the nuclear build out case, only 10 GW of electrolyzer capacity is needed, working at almost 100% capacity utilization. A little production is lost when hydrogen production “flexes” down to meet the lower contribution of wind/solar especially in the winter. But compared to the wind power alternative a much steadier flow of hydrogen is produced here. This will also alleviate the need for large LRC stores.
Discussion
Both scenarios can be made to work and will provide the demanded power for consumption for general use and for hydrogen production. But they have very different characteristics. The wind build-out scenario is much more dynamic in its behavior and demands a number of regulating mechanisms to handle the varying wind and solar power. Heavier use of the hydro flexibility, more import/export, curtailment and possibly also deficits that need to be handled with yet another back-up mechanism.
This dynamism is absent in the nuclear build-out where the power sources delivers more timely and on demand with the consumption. Due to wind/solar production component there is still some need for flexibility, but it can easy be handled by flexible hydrogen production.
A summary seen from a characteristics point of view in terms of pros and cons that could be extracted
| Wind power buildout scenario | Nuclear power buildout scenario | |
|---|---|---|
| Pros | * Satisfies demand | * Satisfies demand * Less fluctuating power sources * No import dependence (except from Norway) * Less demanding network requirements (lower peak powers) * Stable hydrogen delivery * Higher hydrogen production efficiency due to use of both electricity and heat |
| Cons | * Fluctuating power sources requires more regulating mechanisms (import, backup power sources, consumption flexibility) * Import dependence * Curtails part of the produced energy * Less stable hydrogen delivery which necessitates large storage volumes |
Both systems obviously delivers the demanded power, possibly with some deficit situation in the wind buildout scenario. But they differ in their characteristics. The pros and cons are taken directly from the simulation results.
If we look outside the simulation at some important characteristics as well we have for example for example total cost. Not surprisingly different studies delivers different conclusions about the total cost of an all renewable energy system vs a fossil free (aka a system including nuclear power). A recent large, technology independent study found the nuclear alternative to have a substantially lower cost, considering also such things as network capacity build outs etc. <Link to corresponding GU/Chalmers study supporting wind power build out scenario goes here>
Then there are also other system properties outside the model which should be considered, such as stabilizing inertial response and reactive power handling, which are provided by the nuclear power option, but not by the wind power option, where this must be secured in another way, like synthetic inertia from power electronics and battery systems. With the large variations in wind power production, as well as the location of wind farms, higher demands will also be placed on the transmission, that is, the grid. The large variations in production will also lead to that the margins in the system having to be increased, something we are already seeing in practice as reduced permitted transmission capacity on many links here in Sweden.
Conclusion
While this simple balance model cannot compete with the full scale models and simulations that are made by larger institutions, it does provide good insight into the differences between the two contending types of power systems. That is the renewable energy power system, here in Sweden heavily depending on wind power, and the fossil free power system that have nuclear power as main source. Both systems also uses hydro, solar and bio power as sources.
From a power/energy balancing point of view, the nuclear alternative is clearly superior to the wind power alternative since it provides power in a smoother fashion that actually fits the demand. This eliminates the need for many power regulating mechanisms that must compensate for the varying wind/solar power. These mechanisms makes the wind powered system more complex and hence more error prone. It is also dependent on import that may not always be available, or on large deficit energy stores. The nuclear alternative has none of these drawbacks.
Update 2023-03-29:
Consumption flexibility added to the model. It is shown to somewhat ease the deficit situation during winter in the wind/sun scenario. However consumption flexibility is not enough to avoid black-outs, also 5x the assumed available battery storage is needed (instead of 10x without consumption flexibility).