
Bengt J. Olsson
Twitter: @bengtxyz
Solar power installations are increasing at an exponential rate in Sweden right now. And what it is it not to like about solar power? Provides free energy right into your house or apartment, and if you can’t use the energy just sell it back to your utility company at spot prices. With the incomparably high prices that have prevailed recently, the contribution from solar power becomes even more important.
But in this post, we are not going to look at the household aspect of solar power but at its contribution to the national electricity system. Unfortunately, solar electricity in Sweden has the characteristic that it contributes the most in the summer when the power is needed the least.
An assumption is that on the national level solar power contributes to saving water in the hydro power reservoirs during the summer, which can then be used during the more energy-demanding winter. As we will show, this assumption is not entirely correct since we’re in the winter really not energy limited, but rather power limited.
For our simulation, we will use the 195 TWh 2030 scenario with four options for hydro/solar power: 70 TWh hydro power (normal year) with wind + solar power or wind only, 60 TWh (dry year) also with wind+solar vs wind only. As in the referenced post above we will assume that if solar is included it is 10 TWh yearly.
Hence hydro and solar power are given for each option (as well as nuclear/thermal power) in all simulations. We add wind power to all options until they balance.
Below is a combined graph with all 4 combinations of 70/60 TWh hydro power and 10/0 TWh solar power, with a table providing the needed wind energy for balance.
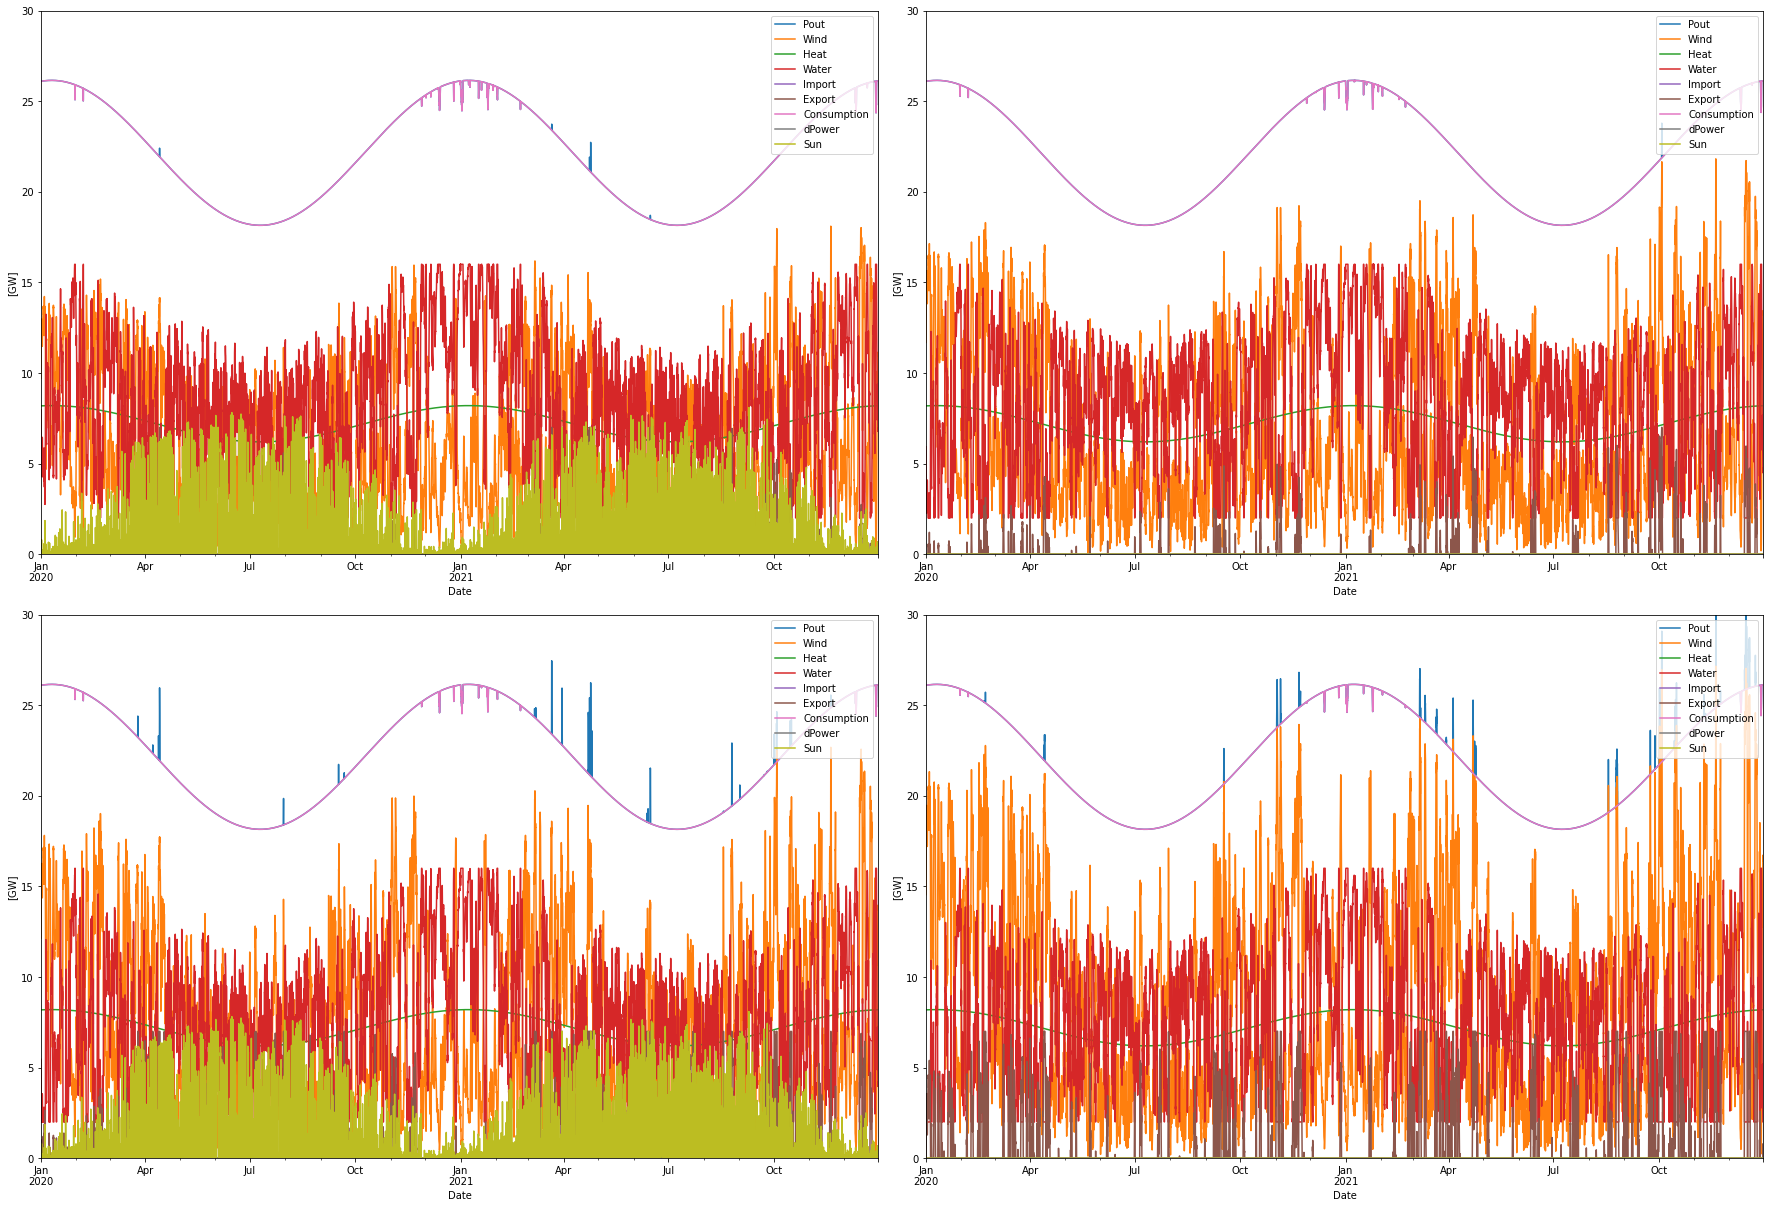
The most significant differences are listed in the table below:
| Yearly production/ export [TWh] | Solar Power = 10 | Solar Power = 0 |
| Hydro Power = 70 | Total prod: 195.59 Wind power: 52.30 Export: 1.21 | Total prod: 196.25 Wind power: 63.04 Export: 1.84 |
| Hydro Power = 60 | Total prod: 198.65 Wind power: 65.52 Export: 4.12 | Total prod: 201.60 Wind power: 78.45 Export: 6.81 |
Discussion
So what is the difference between these options? All four options can supply power in a balanced way without noticeable deficits. The major strain comes in the winter, and then all four cases look pretty much the same. Neither solar nor wind power helps very much, but it is hydro and nuclear/thermal power that delivers most of the needed power then. Thanks to the fact that a large part of the consumption is hydrogen production in this scenario, which can decrease its production during the winter when needed, no power shortages are occurring1.
In both the normal and the dry hydro years, solar offsets wind power in a good way. In the normal year 10 TWh of solar energy offsets 10.7 TWh of wind energy. In a dry year, the same 10 TWh solar offsets 12.9 TWh. The relative overproduction from wind power in the different cases are reflected in the higher exports for the wind only cases.
The difference in solar/wind offset in the 60 and 70 TWh hydro cases reflects the fact that solar power offsets relatively more hydro power than wind power does, since solar power does not fluctuate as much as wind power2.
From these simulations, solar power has the upper hand in terms of needed power production to satisfy the demand (and hence export less).
Note however that Dec 2020 – Jan 2021 had unusually low wind production that could affect the balance between solar and wind production. Also the solar statistics that is from Denmark might not be exactly the same as for Sweden which generally is on higher latitudes and thus would have a more pronounced summer/winter difference in the solar power production. But the general conclusions would probably the same also considering this differences.
So both the wind only and wind + solar power options are quite exchangeable, making it more of an economic choice, and a choice of preferences between wind and solar power.
A hard thing to simulate is what happens if we dimension wind/solar power for a dry year but get a normal year or vice versa, dimension for a normal year, but get a dry year3. But these two cases will in practice either result in that the deficit or excessive power is either imported or exported. One possible way to solve this dilemma is to dimension for the dry year and then let the thermal (bio-) energy take up the slack.
Conclusions
From these simulations of a mid/near future scenario for Sweden the solar power and wind power options are quite exchangeable from a power/energy delivery point of view. It becomes mostly a question about cost or preferences that decides which to use.
Neither solar nor wind power provides any significant amounts of power during the winter in this simulation. The winter consumptions relies more on hydro, nuclear and thermal power.
A strategy is needed for how to handle the difference between normal and dry hydro years. In order not to depend on import/export to balance this difference, one possible solution could be to dimension solar/wind power for a dry hydro year and use thermal (bio-) power as a slow balancer of hydro power.
Footnotes
- Power deficit could definitely occur during the winter since this model does for example not handle day/night variations in consumption which would add maybe ± 3 GW to the consumption curve and hence bottom out the flexibility given by hydrogen production. But the model does not predict longer deficit periods given how it is set up.
- This is not super-easy to grasp. But an analogy with submerging a body into water and see how the water level is changed could be helpful. The solar power here is more “completetely” submerged than the peaky wind power. This tweet (in Swedish) discusses a similar situation.
- This is because the model is a balance model with a “merit order” of power sources dispatched. More precisely the model tries to balance the “must run” sources (that is, wind/solar plus nuclear/thermal) with hydro power until consumption is met. The model “demands” that hydro power is a balancing power and cannot be fixed. But this is actually a problem in real life also. You don’t know beforehand if the year is going to be a normal or dry hydro year, so you cannot be sure on how to dispatch the hydro power. So the simulation model can only “assume” that you will spend for example 60 or 70 TWh of hydro power and then you adjust your must run sources until this spending is achieved.