Bengt J. Olsson
Twitter: @bengtxyz
LinkedIn: beos
Background
The model
Simulations
Discussion
Conclusions
Background
Following the same trend as many other countries, Portugal plans to increase its power generation to support more electrification, especially for hydrogen production to support a Power-to-X industry. In the so-called “conservative scenario” almost all the increase in power consumption targets the latter industry, while “classical” consumption is projected to be about the same as today. The expansion of the power system is envisioned to utilize renewable energy sources, on/offshore wind and solar power. Here, the projected consumption and generation are provided to a balance model to investigate the feasibility of the scenario. The balance model uses “standardized” generation and storage costs to find an optimal balanced power mix. Also, nuclear power is included in the optimization to investigate if this could be an alternative. Projected numbers are provided by the report “Relatório de Monitorização da Segurança de Abastecimento do Sistema Elétrico Nacional 2024-2040 (RMSA-E 2023)” termed “RMSA” below.
The model
The model is a balance model that balances “must-run” sources with flexibility sources. Must-run are Wind, Solar, Thermal, and optionally Nuclear. Flexible sources are here hydropower, hydrogen production, and import/export. Batteries are not included, the installed amount is projected to be 1.8 GW and used together with solar power. Hence batteries could affect the daily variation pattern that is not modelled. Since the projected “classical” consumption in 2040 is projected to be more or less the same as today, consumption is simply modeled by using the actual load during 2021-2023, taken from ENTSO-E. This consumption was 50 TWh. The hydrogen production volume in 2040, in the conservative scenario, corresponds to a consumption of 47 TWh. Thus the total consumption lands at 97 TWh per year.
Dispatch is handled according to a merit order loosely based on estimated marginal costs for the different sources. In this case, it is quite simple. Since the marginal costs for RE (and nuclear) are close to zero, these are dispatched first (they are the “must-run” sources). Flexibility is more difficult to handle in a dispatch model since it will not only depend on the marginal cost but also alternative costs. In principle, a more detailed knowledge of pricing is needed, which is out of scope for this simpler model. But it is possible to assign a useful merit order anyway. In this case, it is done as follows.
- First stored hydro is dispatched. With a relatively small assumed storage capacity of 20 GWh, it will help with smoothing out the daily variations somewhat.
- Secondly, hydrogen production flexibility is dispatched. This means that if a power deficit occurs (that is, power from must-run sources and the already dispatched hydro is not enough to serve the load), less hydrogen is produced and hydrogen is delivered from the hydrogen storage instead. Oppositely, if must-run power is in excess of the load, hydrogen production is increased and the excess hydrogen produced is stored in the hydrogen storage.
- If flexibility of 2. is not enough, import/export flexibility is dispatched.
- If the storage level is below 5%, the order of 2. and 3. above is reversed for the deficit case. This lowers (in practice, eliminates) the risk of running the hydrogen store empty.
This dispatch model is just a course model representation of the actual dispatch, but it behaves intuitively correct. A simple price function, based on residual load, is implemented just to assign a cost for import/export power. The function is a linear function of the residual load (RL) with a
price = 90 + 4 * RL USD/MWh, with RL in GW. This function assigns a higher price to import and a lower to export which is likely in a RE-dense scenario. The price function could be used to fine-tune the dispatch above, but this is not done.
Power production statistics for onshore wind and solar for 2021-2023 were collected from ENTSO-E and then normalized. Installed onshore wind capacity has been more or less the same throughout the period so no normalization was done for that source. Offshore wind had no statistics so it was invented as follows: It is expected that offshore and onshore wind in Portugal will be strongly correlated due to the proximity to the ocean. Hence offshore wind statistics were constructed from the onshore wind statistics by multiplying the onshore values with a correction factor that varied from 110% at low power levels up to 100% at the highest levels. Hence the offshore wind statistics show a somewhat stronger delivery a lower production levels compared to onshore wind, which could be expected. For solar a linear normalization was performed to align with 2023. The result is three years aligned with 2023 values. Thermal production is just assumed to be a mean of 1 GW (8.76 TWh/year) with a sinusoidal dispatch over the year.
4 GW export / 4.7 GW import capacities were assumed per RMSA.
Each source is associated with a CAPEX and OPEX cost:
| Component | CAPEX (overnight cost) | OPEX (yearly cost) | Lifetime | Capacity factor | Discount rate | LCOE |
|---|---|---|---|---|---|---|
| Solar/PV power | 0.5 BUSD / GW | 3% of CAPEX ( 15 MUSD / GW / year ) | 25 y | 17% | 6% | 34.2 USD/MWh |
| Onshore Wind power | 1 BUSD / GW | 3% of CAPEX ( 30 MUSD / GW / year ) | 25 y | 32% | 6% | 25.9 USD/MWh |
| Offshore Wind power | 2.5 BUSD / GW | 3% of CAPEX ( 75 MUSD / GW / year ) | 25 y | 36.5% | 6% | 84.6 USD/MWh |
| Nuclear power | 5 BUSD / GW | 3% of CAPEX + 1 ¢/kWh fuel cost ( 229 MUSD / GW / year ) | 60 y | 89.7% | 6% | 68.5 USD/MWh |
| Hydro* | 0 BUSD / GW | 2% of CAPEX | 40 y | ~15% | 6% | ~60-70 USD/MWh |
| Thermal/Bio* | 0 BUSD / GW | 2% of CAPEX + 5 ¢/kWh fuel cost (468 MUSD / GW / year ) | 40 y | 37% | 6% | 144.2 USD/MWh |
| Hydrogen Storage | 1 BUSD / TWh | 2% of CAPEX ( 20 MUSD / TWh / year ) | 40 y | N/A | 6% | N/A |
| Electrolyzer capacity | 0.5 BUSD / GW | 3% of CAPEX ( 15 MUSD / GW / year ) | 25 y | N/A | 6% | N/A |
| Import/Export** | N/A | (90 + 4*RL) USD/MWh ; RL = Residual Load in GW; (0 if RL < 22.5 GW) | N/A | N/A | N/A | ~20-150 USD/MWh |
*) No CAPEX cost, treated as sunk cost. Thermal includes a cost credit due to the double use as a combined heat and power provider.
**) Simple linear approximation of import/export prices based on the Residual Load.
The capacity factors for RE may seem conservative in light of for example what is projected in the Danish case (or maybe it is the other way around…).
Given the above data, an annualized cost is calculated for each component in the power system. The net cost for import/export and the hydrogen flexibility is added to the total annualized cost. This total annualized cost is divided by the annual load serving energy production to estimate the system LCOE (where all costs are internalized). Also listed is the component LCOE.
Produced hydrogen is added to a finite-size store and hydrogen is delivered from this store at a rate of 47/8.76 ~ 5.4 GW. Hence the minimum electrolyzer capacity is 5.4 GW (100% utilization factor). The RMSA report states 10 GW of electrolyzer capacity in 2040, thus utilizing 54%. In the simulations below the capacity is a parameter between 5.4 to 20 GW, to be optimized. A maximum of 2 TWh storage capacity is assumed (in six existing salt caverns). But anyway, the storage capacity size was set as an optimization parameter to see what would actually be needed (according to 2021-2023 RE statistics).
The model then runs an optimization algorithm to find the system with the lowest annualized cost (or system LCOE), subject to two conditions:
- No power deficit must occur
- Hydro production must be less than 12.5 TWh (net hydropower production will be lower since several TWh are pumped back to the reservoirs)
A large difference between the RMSA model and this model is that RMSA assumes dedicated capacity for hydrogen production, while in this model the power system is considered as one system, and it is this system that serves both “classic” consumption as well as hydrogen production. This will lead to better resource utilization which will be seen.
Simulations
Two simulations are done
- Cost-optimized
- Cost-optimized with 4.8 GW nuclear forced in
Cost-optimized scenario
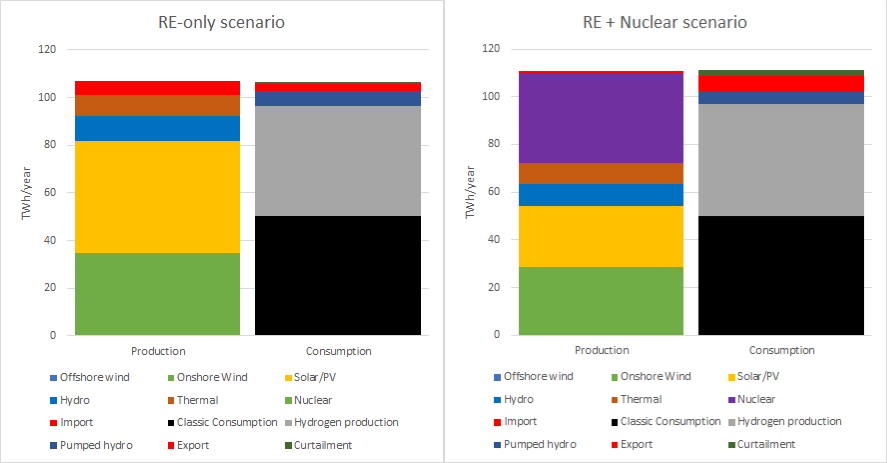
In this scenario, the inclusion of offshore/onshore wind and solar power as well as the size of the hydrogen storage and electrolyzer capacity is optimized. Nuclear power is held at zero. The outcome of the cost-optimized scenario simulation is shown below.
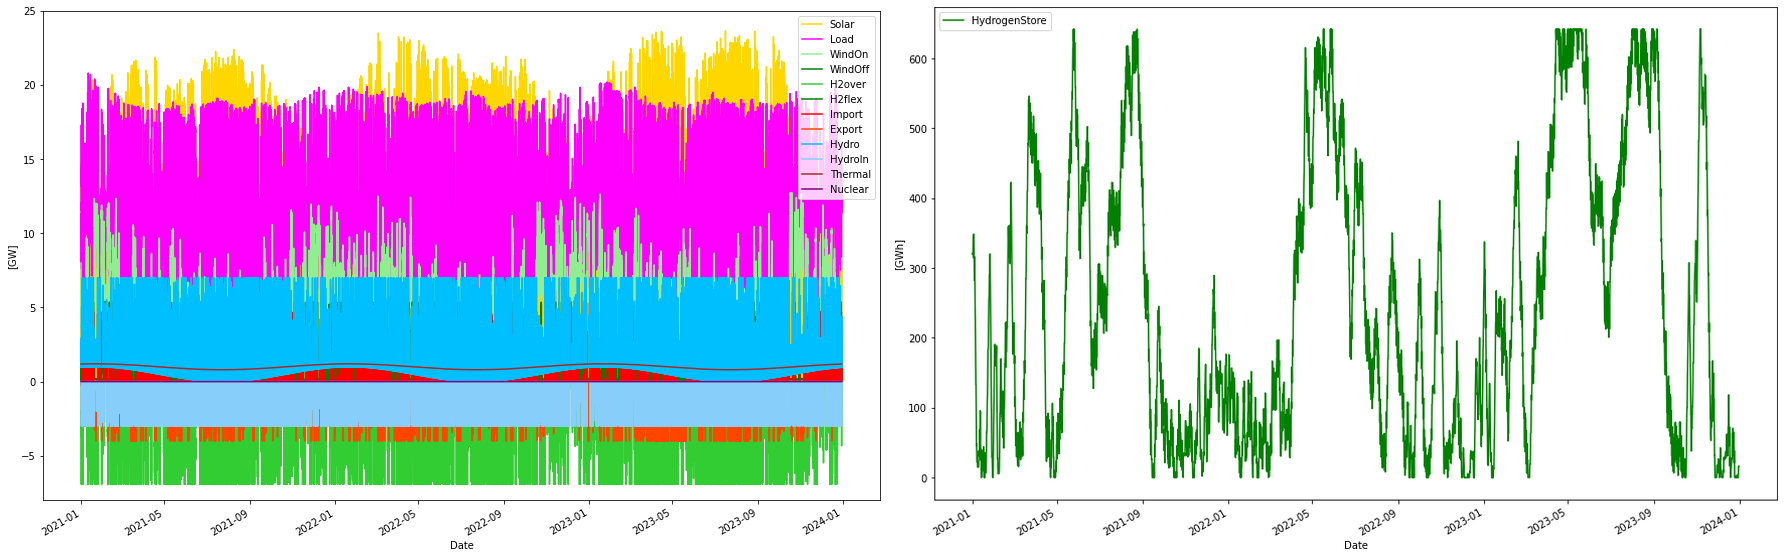
Right: Hydrogen storage levels. 5.4 GW worth of hydrogen is delivered from the store each hour. However, due to production flexibility, the store level will vary.
Consumption per year:          96.51 TWh
Consumption H2 per year:       46.34 TWh
Produced WindOn per year:      34.20 TWh
Produced WindOff per year:      0.55 TWh
Produced solar per year:       46.80 TWh
Produced thermal per year:      8.76 TWh
Produced hydro per year:       10.66 TWh
Consumed hydro per year:        6.28 TWh
Produced nuclear per year:      0.00 TWh
Nuclear capacity factor:        89.90 %
Curtailed per year              1.28 TWh
Deficit per year                0.02 TWh
Import per year:                6.10 TWh
Export per year:                3.01 TWh
H2flex per year:               14.17 TWh
H2over per year:              -13.55 TWh
Max overshot:                  15.50 GW
Max shortage:                  -2.09 GW

Yearly energy balance
---------------------
Total supply:                 107.08 TWh
Total demand:                 107.08 TWh
Balance:                       -0.00 TWh

Yearly H2 store balance
-----------------------
Total produced:                46.34 TWh
Total delivered:               46.45 TWh
Store change:                  -0.11 TWh
Balance:                       -0.00 TWh

                  Installed Capacity Unit  TWh/year  CAPEX/GW(h)  OPEX/MW(h)/y   CRF  Tot CAPEX  Tot OPEX  Ann Cost    LCOE
WindOn                       12.200   GW    34.200        1.000        30.000 0.078      6.656     0.366     0.887  25.927
WindOff                       0.171   GW     0.548        2.500        75.000 0.078      0.428     0.013     0.046  84.621
Solar                        31.426   GW    46.800        0.500        15.000 0.078     14.463     0.471     1.603  34.248
Nuclear                       0.000   GW     0.000        5.000       229.000 0.062      0.000     0.000     0.000  68.365
Thermal                       2.700   GW     8.758        0.000       467.922 0.066      0.000     1.263     1.263 144.248
Hydro                         7.600   GW    10.663        0.000        80.000 0.066      0.000     0.608     0.608  57.022
H2Store                     642.100  GWh     0.000        0.001         0.000 0.078      0.642     0.000     0.050     inf
H2Elys                       12.288   GW     0.000        0.500        15.000 0.078      6.144     0.184     0.665     inf
H2CCGT                        0.000   GW     0.000        0.750        15.000 0.078      0.000     0.000     0.000     NaN
Import                        1.000  N/A     6.096        0.000       875.191 0.060      0.000     0.875     0.875 143.570
Export                        1.000  N/A     3.005        0.000       -69.488 0.060      0.000    -0.069    -0.069 -23.123

Total over-night cost           28.3 GUSD
Total yearly OPEX costs          3.7 GUSD
Annualized cost               5.9282 GUSD
System LCOE                  61.4224 USD/MWh
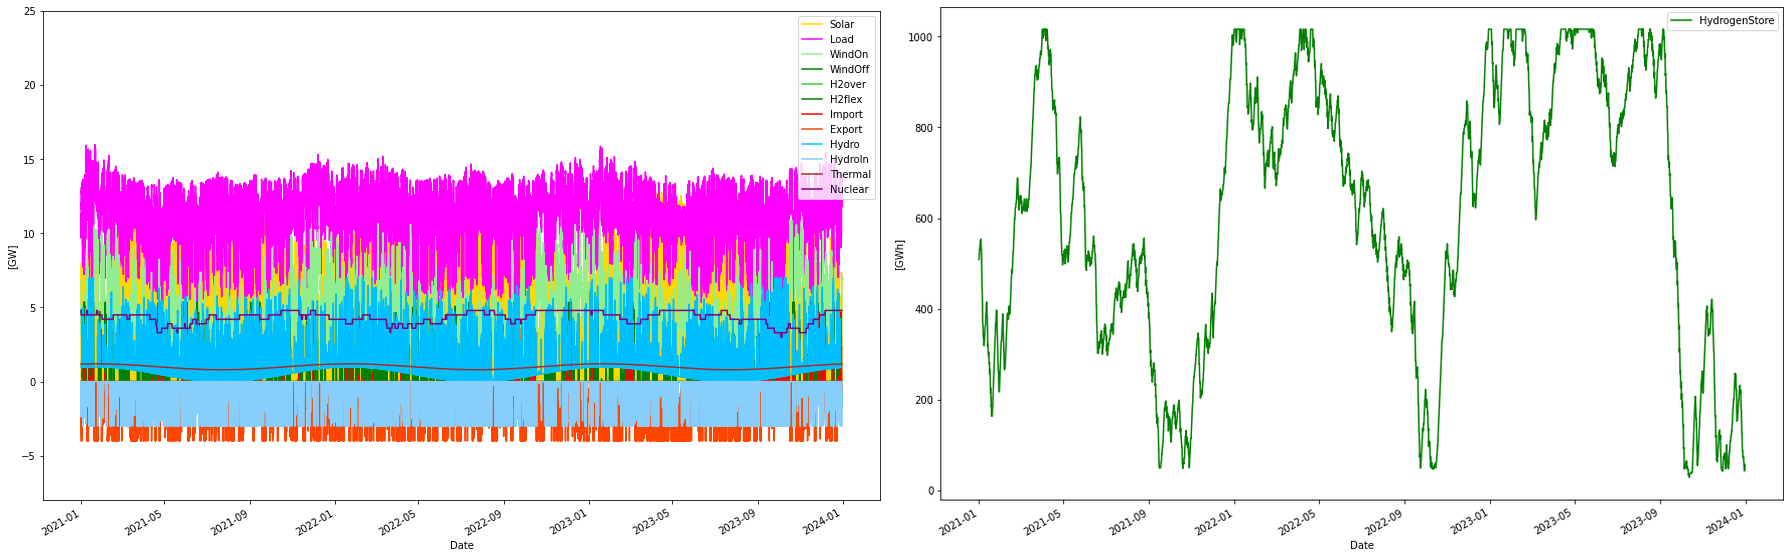
Cost-optimized with 4.8 GW nuclear forced in
In this scenario, nuclear power is added to the mix. It is done by adding16 reactors, all having 300 MW capacity, summing up to a total of 4.8 GW nuclear power capacity. Each reactor has random on/off-line times (Markov chain), providing a varying total output, here with a capacity factor of 89.9%
Consumption per year:          96.98 TWh
Consumption H2 per year:       46.81 TWh
Produced WindOn per year:      29.16 TWh
Produced WindOff per year:      0.00 TWh
Produced solar per year:       25.27 TWh
Produced thermal per year:      8.76 TWh
Produced hydro per year:        9.07 TWh
Consumed hydro per year:        4.69 TWh
Produced nuclear per year:     37.80 TWh
Nuclear capacity factor:        89.90 %
Curtailed per year              2.06 TWh
Deficit per year               -0.00 TWh
Import per year:                0.39 TWh
Export per year:                6.72 TWh
H2flex per year:                5.26 TWh
H2over per year:               -5.12 TWh
Max overshot:                  10.77 GW
Max shortage:                   0.00 GW

Yearly energy balance
---------------------
Total supply:                 110.45 TWh
Total demand:                 110.45 TWh
Balance:                        0.00 TWh

Yearly H2 store balance
-----------------------
Total produced:                46.81 TWh
Total delivered:               46.96 TWh
Store change:                  -0.14 TWh
Balance:                       -0.00 TWh

                  Installed Capacity Unit  TWh/year  CAPEX/GW(h)  OPEX/MW(h)/y   CRF  Tot CAPEX  Tot OPEX  Ann Cost    LCOE
WindOn                       10.402   GW    29.160        1.000        30.000 0.078      4.858     0.312     0.692  23.736
WindOff                       0.001   GW     0.002        2.500        75.000 0.078      0.002     0.000     0.000  84.621
Solar                        16.969   GW    25.270        0.500        15.000 0.078      7.234     0.255     0.820  32.468
Nuclear                       4.800   GW    37.800        5.000       229.000 0.062     24.000     1.099     2.584  68.365
Thermal                       2.700   GW     8.758        0.000       467.922 0.066      0.000     1.263     1.263 144.248
Hydro                         7.600   GW     9.069        0.000        80.000 0.066      0.000     0.608     0.608  67.045
H2Store                    1016.600  GWh     0.000        0.001         0.000 0.078      1.017     0.000     0.080     inf
H2Elys                        7.164   GW     0.000        0.500        15.000 0.078      3.582     0.107     0.388     inf
H2CCGT                        0.000   GW     0.000        0.750        15.000 0.078      0.000     0.000     0.000     NaN
Import                        1.000  N/A     0.393        0.000        50.645 0.060      0.000     0.051     0.051 128.714
Export                        1.000  N/A     6.718        0.000      -325.787 0.060      0.000    -0.326    -0.326 -48.494

Total over-night cost           40.7 GUSD
Total yearly OPEX costs          3.4 GUSD
Annualized cost               6.1604 GUSD
System LCOE                  63.5203 USD/MWh
Discussion
In the RE-only alternative, we can see that onshore wind and solar power are built out to the maximum capacities, while offshore wind power is largely excluded for cost reasons. Both pumped hydro and import are heavily exercised as balancing power sources. Typically these could be traded off against each other, but since both are heavily utilised it is hard to do that in this case. The way to off-load both these resources would be to supply more RE power, which the optimizer finds less cost-effective. It is difficult to distinguish power delivery from pumped hydro and reservoir/run of river hydro, but the patterns from the simulations have some resemblance from for example Energy Charts that also seem to have the same problem. (In Energy-charts it can be seen that pumped hydro supply is larger than consumption for example, when it really should be the other way around considering losses). Overall the produced amounts of hydro as well as pumped hydro are reasonable.
In the nuclear build-out alternative, the overall power delivery is smoother with lower power swings due to a lower share of RE. In this alternative offshore wind is completely eliminated, since it is possible to replace it with onshore and solar power. Hydropower and import are less exercised as balance sources. Looking at the dispatch graphs side by side, it can be seen that the nuclear build-out scenario provides a more balanced power system. Interestingly the nuclear build-out scenario has higher curtailment than the RE-only, 2 TWh vs 1.3 TWh. The difference is also reflected in the higher export amount that the nuclear build-out scenario has (6.7 TWh vs 3 TWh for the RE-only scenario).
Cost-wise the nuclear build-out alternative has much higher CAPEX costs, but given the longer lifetime of nuclear plants, the investment is spread out over a longer time, making the System LCOE only a little more expensive than the all RE alternative, 63.5 vs 61.4 USD/MWh.
Conclusions
This model is of course very coarse and does not include transmission costs and limitations, and not system stability costs that are needed for a well-functioning system. However, it seems from the model that Portugal has the right conditions for utilizing a high degree of variable renewable energy sources: Relatively low seasonal variation in consumption and generation patterns and a high capacity access to balancing hydropower. A cost-optimal RE-only system is possible with build-out using only relatively low-cost onshore wind and solar power, with a slight addition of offshore wind. 120% more onshore wind, but 12 times the present installed capacity of Solar PV power.
With the forced nuclear build-out scenario the RE build-out is limited to 90% more on-shore wind power and 7 times today’s solar power. Plus of course 4.8 GW of nuclear power. This alternative has a higher CAPEX but almost the same System LCOE (63 instead of 61 USD/MWh). Hydro and import are less exercised for balancing power and the whole system behaves “smoother”, with less power swings. Most probably transmission and system costs will be lower for this alternative as well even though it is not part of this model.
It also seems like Portugal has the necessary storage capacity for hydrogen in the form of salt caverns. Out of the estimated 2 TWh (1.2 TWh H2 LLV) storage capacity, only 0.64 and 1 TWh were used in the RE-only and RE+nuclear cases respectively. A big difference between this model and the RMSA model is that this model does not reserve capacity for hydrogen production, rather hydrogen is considered a consumer, with certain characteristics, of the common power system. This should be a more efficient use of the resources.