
Bengt J. Olsson
Twitter: @bengtxyz
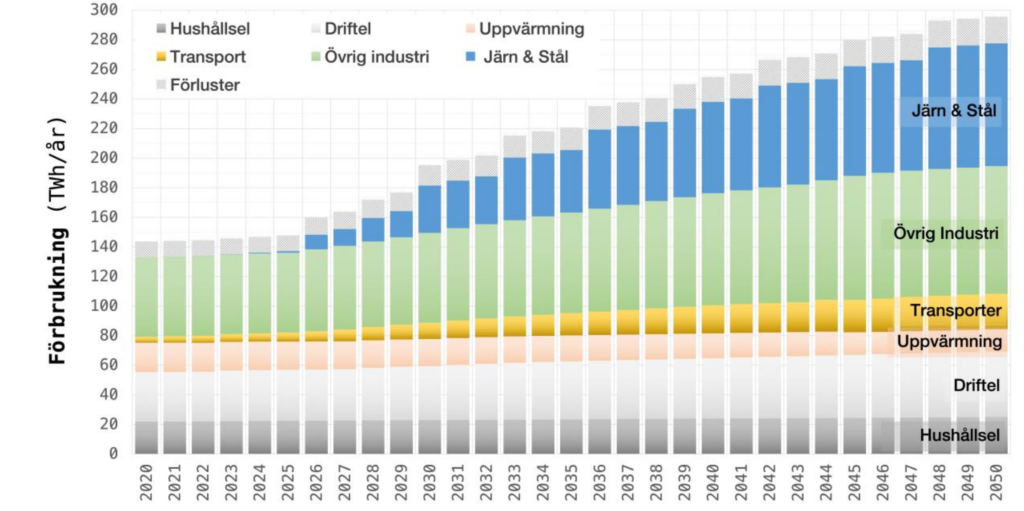
In this post we will analyze a 2030 scenario that is 8 years away from now. The demand is captured from the “Scenarioanalys 2050” report1. In the figure below (from that report) it can be seen that the consumption 2030 will be about 195 TWh out of which 30 TWh are used for hydrogen production for the steel industry.
We will further assume that the current level of combined nuclear + biopower will stay the same as today at about 63 TWh per year and also that the solar (PV) power contributes with around 10 TWh per year. Given the exponential rate of installed PV power we can see now, this does not seem unreasonable at 2030. We also assumes a “standard” hydro production year of 66-67 TWh.
We then use the balance model, adjusting and iterating variable parameters until we get a system that is consistent with the above constraints. A novel approach used in this simulation is to consider the Swedish and Norweigan hydro reservoires as “combined”. That is, instead of modelling the Swedish hydro system as a balancing power source that may vary between 2 – 13 GW and then use import power for further balancing, we instead consider the about 3 GW import capacity we have from Norway be part of this combined hydro system (after all import from Norway comes from their hydro power). Hence we get a combined hydro system which can vary between 2 – 16 GW instead. And we adjust a standard hydro year to be around 70 TWh of which 3 – 4 TWh really are import from Norway3.
Hydrogen production
Approximately 30 TWh will be used for hydrogen production, mainly used by the steel manufacturing companies. The hydrogen production uses electrolyzers to produce green hydrogen and will be used in two “modes”:
- Electrolyzer consumption is part of the “consumption profile”, that is, the plannable output of the power system. This portion is plannable since the demanded consumption can be met (except in rare deficit situations) using variable sources together with balancing sources. (3.4 GW in this simulation).
- Electrolyzer capacity to utilize the excess power above the consumption profile. This power would otherwise be exported or curtailed. (1 GW in this simulation)
Electrolyzers belonging to the first category also constitutes a flexible resource, since they can be throttled down when the supplied system power is not sufficient to balance the variable power sources. So they are part of the balance equations supplying variable load to the system. (The other category of electrolyzers are of course also part of the power balance system, but not as useful as the first category, since it only offsets power to be exported or curtailed, and thus not help in deficit situations).
As usual we also look at the output rate of the hydrogen production to infer the size of a hydrogen store that would enable an even usage of the produced hydrogen.
Simulation results
The graph below shows the power dispatch and the consumption of the power:
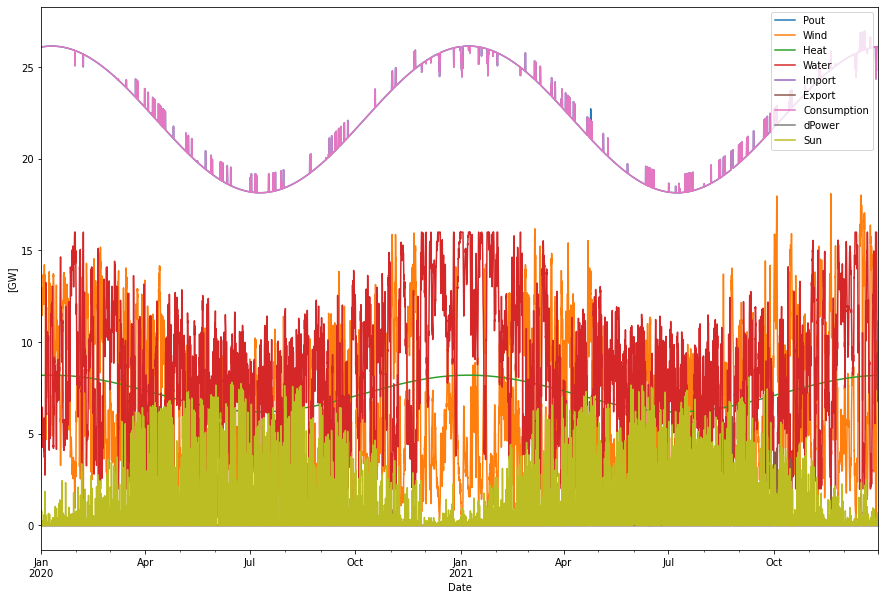
Simulated wind power is 2020/2021 Swedish wind power scaled linearly to provide the requested energy. PV power is likewise Danish PV power from 2020/2021 scaled to provide about 10 TWh. The system is well balanced and have the following characteristics:
Supplied power per year:      195.59 TWh
Consumption per year:         194.88 TWh
Produced hydro per year:       70.23 TWh
Produced wind per year:        52.30 TWh
Produced sun per year:          9.85 TWh
Produced nuc/bio per year:     63.20 TWh
H2 production per year:        30.22 TWh
- From excess power:            0.50 TWh
- Within consump. profile:     29.73 TWh
Cap. util. electrolyzers:      78.41 %
Curtailed per year              0.00 TWh
Deficit per year               -0.00 TWh
Max shortage:                  -0.00 GW
Max overshot:                   0.64 GW
Import per year:                0.00 TWh
Export per year:                0.71 TWh
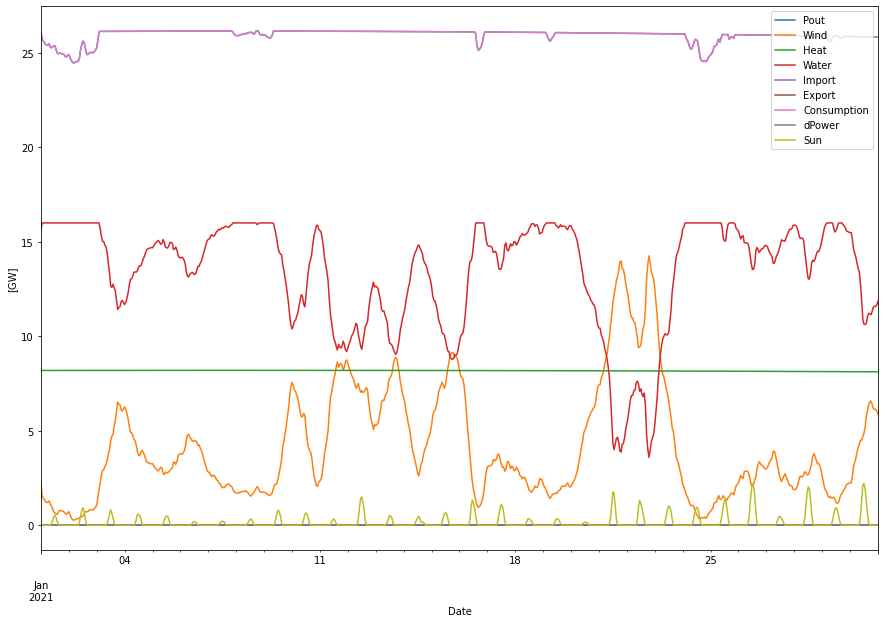
Below is January 2031 expanded. It can be seen that the PV power is negligible and that hydrogen production flex lowers the consumption when hydro production at its maximum production (16 GW) together with added wind/PV production is not enough to meet the full consumption profile.
Discsussion
We can see that this system could work nicely without difficult deficits or import dependence (other than from Norway as described above). In the low wind period of December 2030 to January 2031 the electrolyzers has to flex their production somewhat to balance the lack of supplied system power, but not significantly much, and the system does not display any shortages of power (after hydrogen flex).
There will however be shortages if we also considers on the diurnal consumption variation that is not modelled here (for clarity reasons). That is the smooth consumption curve we have models the average hourly power consumption, but we know that we have a consumption difference of maybe ±3 GW between day and night. With addition of this diurnal difference there will probably be some hours with power deficit, telling us that we are on the border to some instability. In practice this could probably be handled by more import (if available at that time…) or some peaking power plants.
The system requires about 52 TWh/year of wind power. This is less than double the amount that we had in 2020/2021 and according to the Swedish wind energy association we will be there already in 20252. So additional wind energy installed after that will be solely be for export. Note that the wind energy number depends on the assumption of 10 TWh of PV power, so it could be more or less required on the solar PV power development.
Both import and export is at low levels (except for the implicit import from Norway that is included in the combined Norway-Sweden hydro power model).
Hydrogen production
In order to achieve 30 TWh of hydrogen we need to use 4.4 GW electrolyzers. These are divided such that 3.4 GW is used within the consumption profile (and thus contributes to flexibility) and 1 GW is used to “shave off” power peaks, above the consumption profile. But as can be seen in the results above this 1 GW part only contributes to less than 2% of the production and might as well be left out and instead the other part could have been increased marginally to get the same amount of energy.
The “upper” part of the electrolyzers is left in here because it illustrates the fact that it is not sufficient to just use the “power peaks” from wind/solar power to produce the hydrogen, which is often argumented for. The low utilization of that electrolyzer capacity will kill the business case for it. Instead hydrogen production will mainly be part of the common power demand, which is also a good thing since delivery will be more steady as seen below.
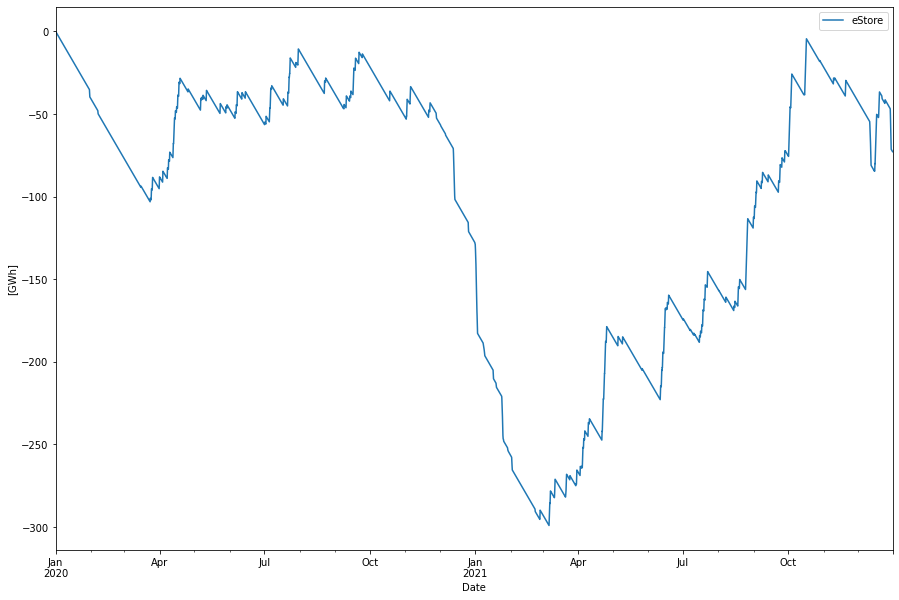
The size of the store is about 300 GWh and is dimensioned by the low winds of Dec 2030 – Jan 2031, when less than average hydrogen is produced. This is because hydrogen production is flexing down during this time to meet lower power supply.
The impact of combining the Norway-Sweden hydro systems instead of using only Swedish hydro power and explicitly importing power is that hydrogen production would flex to a higher degree since hydrogen flex comes before import in the dispatch “merit order” (but after hydro power dispatch) in this balance model. Hence less hydrogen would be produced. In real life there will probably be something in between. If Norweigan import becomes to expensive, hydrogen production is muted and vice versa. But a result of the higher degree of hydrogen production flexibility would be the need for a much larger hydrogen store (about 2 TWh if hydrogen flex has strict priority over import).
Conclusions
The 2030 scenario looks really realistic from a power balancing point of view. Given that the solar PV production becomes 10 TWh in 2030 we will need approximately twice the wind power of 2020/2021 or about 52 TWh yearly, which we will reach already in 20252.
Note that balance requires both that we can import about 3 GW hydro power from Norway and that electrolyzers are used in a flexible mode and can mute their production when needed. Almost all hydrogen is steadily produced within the consumption profile (and not from power peaks) and will require a levelling storage between 0.3 – 2 TWh depending on the degree of hydrogen production flex.
In this model there are no internal constraints inside Sweden. Hence it must be ensured that the hydro power from the north can balance the wind/sun power in the south where the new production preferably is built. The north – south aspect would need some further inspection.
Footnotes
- https://www.svensktnaringsliv.se/sakomraden/hallbarhet-miljo-och-energi/kraftsamling-elforsorjning-scenarioanalys-290-twh_1187495.html
- https://svenskvindenergi.org/wp-content/uploads/2022/10/Statistics-and-forecast-wind-power-Sweden-Q3-2022-Final.pdf
- Update 2022-12-31. A closer look at the import statistics reveals that the gross import Norway to Sweden (with “slingkraft” subtracted) is about 7.2 ±2.5 TWh 2004-2021. This means that a normal hydro year in this model should be about 74 TWh and have a power range of 2-16 GW. However it changes little in the simulation. Mainly the required wind power delivery decreases with the same 4 TWh to 48.2 TWh. The lower wind power also decreases the export from 0.7 TWh to 0.4 TWh but otherwise the differences are really small.