
Bengt J. Olsson
Twitter: @bengtxyz
I finally got around to add solar (PV) power to the balance model. As I suspected, this did not significantly change the conclusions that could be drawn from the wind-only model. But of course, for the sake of completeness, we should also include solar power in the balance model.
Since I couldn’t find hourly data for Sweden, I used hourly data for Denmark 2020/2021 from ENTSO-E instead. Since Denmark is at similar latitudes to Sweden, it should give approximately the same statistics1. Below is the resulting graph from the SvK EF 286 TWh scenario, with sun included.
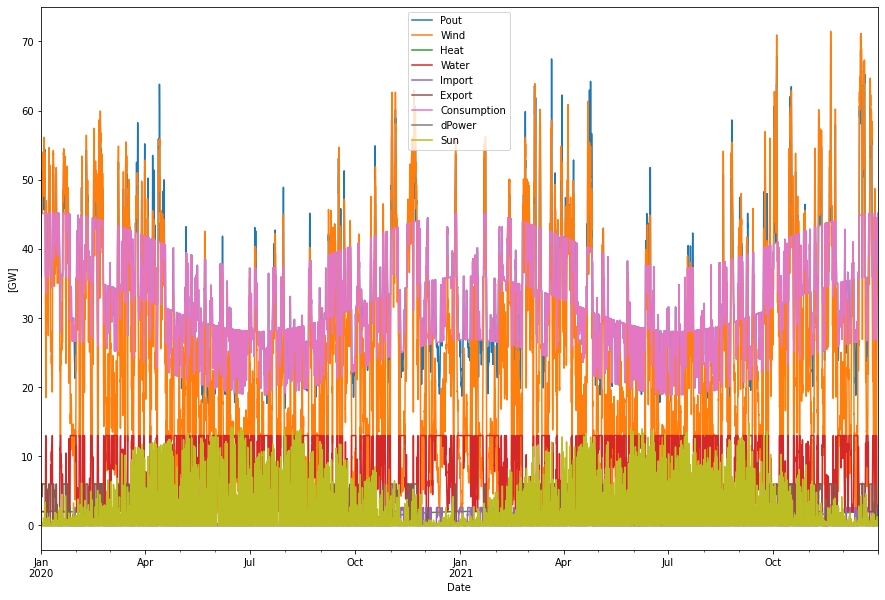
The hourly values are scaled linearly until the sum of the supplied solar energy is 18 TWh/year, which is the result from the SvK EF scenario. In addition, as usual, the wind power is scaled in the same way until the hydro power production becomes 66 TWh. The results in the table below agree well with SvK EF results.
Supplied power per year:      301.37 TWh
Consumption per year:         286.13 TWh
Produced hydro per year:       66.28 TWh
Produced wind per year:       206.46 TWh
Produced sun per year:         18.02 TWh
Produced nuc/bio per year:      9.08 TWh
H2 production per year:        85.07 TWh
- From excess power:           22.08 TWh
- Within consump. profile:     62.98 TWh
Cap. util. electrolyzers:      53.18 %
Curtailed per year              7.80 TWh
Deficit per year                1.07 TWh
Max shortage:                   8.60 GW
Max overshot:                  27.00 GW
Import per year:                1.54 TWh
Export per year:                8.51 TWh
As expected, solar power does not change much in principle. The figure shows that the sun supplements the wind, but only during the summer when the power requirement is lower anyway. The difficult situation with weak wind during the winter of 2021 is not helped by the solar power. The downward peaking blue lines in the graph indicates the power deficits that occur during the low wind periods corresponding to January 2046.
The energy deficit stays roughly the same, about 1 TWh. If I only the solar energy had been added to the model, the deficit would have been slightly lower, approx. 0.86 TWh2. But I also reduced the bioenergy/heat power a bit from today’s 15 TWh used in the wind only models to approximately 9 TWh according to the EF model. Both these changes amounted to instead increase the total deficit to 1.07 TWh.
With energy store
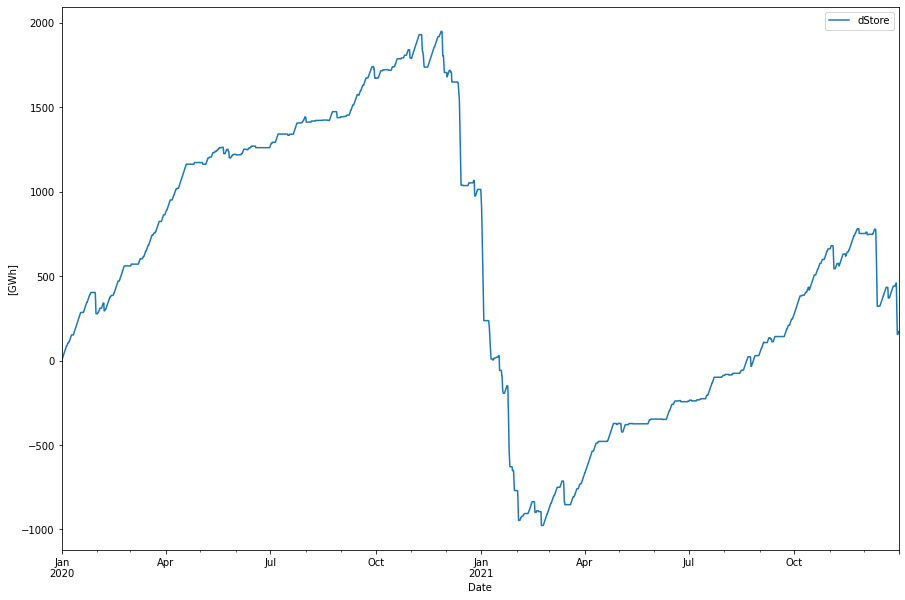
If the model now is modified to include a hydrogen store to handle the deficit3, we can see that it will be almost 3 TWh large. Due to lowering of the bio-power, now the output power from the hydrogen CCGT needs to be 7 GW, instead of 6 GW, to cover the shortfall4. The store level is depicted below
Output from this simulation
Supplied power per year:      302.91 TWh
Consumption per year:         286.19 TWh
Produced hydro per year:       66.18 TWh
Produced wind per year:       208.11 TWh
Produced sun per year:         18.02 TWh
Produced nuc/bio per year:      9.08 TWh
H2 production per year:        84.95 TWh
- From excess power:           21.24 TWh
- Within consump. profile:     63.71 TWh
Cap. util. electrolyzers:      52.54 %
Curtailed per year              7.07 TWh
Deficit per year                0.01 TWh
Max shortage:                   1.61 GW
Max overshot:                  26.47 GW
Import per year:                1.53 TWh
Export per year:                7.99 TWh
Conclusions
Solar power offsets wind power in the summer. Ideally this should save some water in the hydro magazines that could be used in the winter. But the problem with this is that in the winter we are not energy limited, we are power limited. Meaning that we cannot use all the saved hydro energy because the hydro power already runs at maximum capacity in the winter in this model. This means that solar power in Sweden cannot alleviate the power/energy deficits we get in the winter, if the winds are low (like in Dec/Jan in this model).
To conclude, the qualitative differences between the solar + wind scenario and the wind only scenario are small and the conclusions from the initial blog are still valid.
Footnotes
- A Twitter reply informed me that Swedish hourly data is indeed available at the SvK Mimer database. I will change to this data with time, but do not expect any larger differences in the simulation outcome.
- The main reason for the lower deficit is probably because the inclusion of the 18 TWh solar power lowered the total windpower production with some 23 TWh. The lower amount of installed wind power in its turn gives less over/undershots and hence less deficit.
- This hydrogen store is for hydrogen produced in addition to the large amount of hydrogen produced for industrial applications. For this model it could as well be, for example, a store supplied from pumped hydro power.
- Another Twitter reply suggested to use bio-power with CCS instead of a hydrogen store. Thinks this is a very good idea. Given the amounts off bio-mass available, 1 TWh is not much. I don’t know if “deficit-following” is a problem for these power sources? And it would still require up to 7 GW of power to work. A good thing is that these sources are typically located such that they could be used for district heating also (but then the amount of bio-mass consumption may become a problem?).