
Bengt J. Olsson
Twitter: @bengtxyz
There is a lot of discussion going on about the electricity system of the future given the big impact it has on all of us. Discussions about renewables and fossil-free are often based on models developed by various authorities or energy organizations. These are often extensive and hardly accessible to anyone other than researchers and specialists. It is hard if not impossible to get an insight into how the results are generated, and what the conditions are. Therefore, this text presents a simplified model of the electricity system, based on balance equations and a logical “order of merit” for the different types of power sources. The aim is to show that with relatively simple means you can replicate the advanced models that are often used to a fairly high degree, and that you can thereby easily vary different aspects yourself to test your own scenarios and assimilate many insights about the system.
Below is presented the model and simulation of two imagined future electrical energy systems. Both are based on Svenska Kraftnät’s (the Swedish TSO) “Renewable Electrification” (“Elektrifiering Förnybart”; EF) scenario presented in the report “Long-term Market Analysis 2021”1. The EF scenario, that forecasts a doubling of the electricity needs to 2045, mainly uses wind power for electricity production. Hydrogen production constitutes a significant part of electricity consumption in the scenario summarized in Figure 1 below. In this text, we simulate both a wind power and a nuclear power alternative for the need of 286 TWh electricity based on SvK’s EF scenario. This need is divided into 201 TWh of “normal” electricity production and 85 TWh of electricity for hydrogen production.
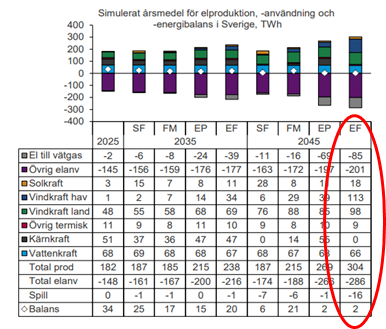
Figure 1. Summary of SvK’s model scenarios.
The result of simulation of the wind power scenario based on SvK’s EF scenario is presented in Figure 2.
Results for the wind power scenario
In the wind power alternative for the EF scenario, we have roughly 8 times more wind power energy than in 2020-2021, and no nuclear power. The figure below shows the result of the simulation.

Figure 2. Power output/consumption for a 286 TWh wind power scenario similar to the SvK EF scenario, with scaled wind power from 2021-2022.
The table below shows the output from the simulation in Figure 2.
Prod power per year:          305.61 TWh
Load per year:                286.25 TWh
Produced water per year:       67.07 TWh
Produced wind per year:       221.60 TWh
Produced nuc/heat per year:    14.98 TWh
H2 production per year:        85.18 TWh
Cap. util. electrolyzers:      52.00 %
Curtailed per year             10.80 TWh
Deficit per year                0.93 TWh
Max shortage:                   7.40 GW
Max overshot                   32.40 GW
Import per year                 1.97 TWh
Export per year                 9.50 TWh
Table 1. Simulation results from the balance model for the SvK EF scenario
If you compare the simulation result above with the results from SvK in Figure 1, we see that our simple model generates the same total energy, approximately the same hydropower, wind + thermal power here corresponds to wind + solar + thermal power in SvK’s model, and everything balances energy-wise. Also total production and curtailment match quite well, although our balance model gives a little less curtailed power and a little more net export. The latter difference mostly depends on what export capacity is assumed to be available. (The export capacity is here arbitrarily set to 6 GW, if you reduce it, the export decreases and the curtailment increases and vice versa).
To better understand the dynamics of the power system and the model, we expand the simulation for January 2021 (the year of the wind data in the simulation). Here we can see in more detail how the balancing takes place. We see that when the wind is weak, the use of hydropower and imports is maximized. Consumption is down to a level corresponding to zero hydrogen production, and the blue line representing total added power cannot constantly meet consumption, so a shortage occurs (unless stored energy can be added or additional flex, beyond hydrogen flex, can reduce consumption). Hydropower oscillates strongly between producing full power in light winds to minimum power in strong winds.
 Figure 3. Enlargement of January 2021 from Figure 2
If you compare SVK’s model with the one presented here, you can see a significant difference in the resulting power/energy deficit after hydrogen production flex. In SvK’s model, we get a deficit of just 0.046 TWh, while the balance model here gives a 0.93 TWh deficit. This is a significant difference as it points to completely different needs for energy storage needed to overcome the power deficit. The difference is mainly due to how the import is modelled. In our balance model, an import limitation of 2.6 GW is conservatively assumed, which corresponds to 70% of the import capacity we have from Norway, which is our main import source, and a relatively reliable one given Norway’s large water reservoirs. In the model, it is therefore assumed that other countries will not be able to contribute with power in a general deficit situation. (Due to correlation of the wind strengths in surrounding countries. That is, if a deficit of wind power occurs in one country, there is probably a deficit in surrounding countries as well). But if in our model we instead use an import limit of 7.4 GW (which is probably closer to SvK’s assumptions), then the same 0.046 TWh deficit will also be found in our model. This suggests that assumptions about import possibilities will be important for how much energy storage will be needed to meet the deficit situations in the wind power scenario.
The next interesting observation concerns hydrogen production. The production is modeled in accordance with SvK according to the passage that in the report states that “Twice the electrolyser capacity has been assumed in the scenarios compared to if the need were evenly distributed over the hours of the year”. Interpreted here as half of the capacity being taken from power peaks that would otherwise be exported or curtailed. This gives a total electrolysis capacity of 18.7 GW (SvK unfortunately does not specify the total electrolyser capacity assumed in its report). This will be utilized to 52% in this simulation. But most interesting is the fact that the production is uneven and follows the variations of the wind power. If you simply assume that the production goes into an imaginary energy storage and that you output 9.7 GW (= 85 TWh/8760 h) from the storage at a steady rate hour by hour, the storage filling will look like in the figure below.

Figure 4. Storage filling in an imaginary hydrogen storage which is filled according to the production in Figure 2 but is emptied at a steady rate of 9.7 GWh/h.
As can be seen, the storage balances (ie starts and ends at approx. 0 GWh), but it becomes gigantic in size, around 16 TWh. This figure can be compared with the largest energy storage that the HYBRIT project (hydrogen reduction of iron ore) in northern Sweden is planning for, which is 100 GWh or 0.1 TWh. However, no such storage exists today, the closest thing to compare it to is the natural gas storage “Skallen” in Halland in southern Sweden, which if converted into a hydrogen storage could store the equivalent of 25 GWh of energy2. The Skallen storage facility is probably the only one of its kind (LRC) in the whole world. Given the unrealistic nature of storing so much hydrogen, we therefore have to accept at a national level that the availability of hydrogen will vary with wind power production.
Corresponding nuclear power scenario
Finally, we can easily evaluate an alternative scenario. Below we have chosen a scenario with 50% more wind power than in 2020/2021, a total of 41 TWh/year, and topped up with approx. 13 GW of nuclear power (in addition to today’s) to reach the equivalent electricity production as in the EF scenario. (Solar power is not yet modeled but will probably not affect the general conclusions that can be drawn from the model).

Figure 5. Alternative scenario with 50% more wind power than today and the rest, approx. 14.5 GW (with 90% capacity factor), expanded nuclear power.
As you can see, this system behaves much nicer. Production matches consumption at all times and hydrogen production flex is not needed except for a few windless winter days. The hydropower is not ramped up/down as hard as in the first scenario, we have no storage/import problems, only half the electrolyser capacity (about 10 GW) which runs at 100% capacity factor and generates a completely even hydrogen production. Details are found in Table 2.
Prod power per year:          286.21 TWh
Load per year:                286.00 TWh
Produced water per year:       67.21 TWh
Produced wind per year:        41.29 TWh
Produced nuc/heat per year:   177.70 TWh
H2 production per year:        85.11 TWh
Cap. util. electrolyzers:      99.95 %
Curtailed per year              0.00 TWh
Deficit per year                0.00 TWh
Max shortage:                   0.00 GW
Max overshot                    0.00 GW
Import per year                 0.00 TWh
Export per year                 0.21 TWh
Table 2. Simulation results for the alternative (nuclear) scenario.
Discussion
The outcome of the two scenario simulations shows that the nuclear power alternative provides a more stable electricity supply than the wind power alternative. The import and storage dependency disappears completely. (In reality, we will of course exchange some production for imports when the price situation allows, but we are not dependent on imports). The other major difference is that hydropower is heavily stressed in the wind power scenario, where it is largely oscillating between producing at maximum or minimum capacity. The question is whether it is even possible to vary the hydropower in this way? In the nuclear scenario with less wind to regulate, hydropower behaves more like today.
Then there are also system properties outside the model, such as stabilizing inertial response and reactive power handling, which are provided by the nuclear power option, but not by the wind power option, where this must be secured in another way. With the large variations in wind power production, as well as the location of wind farms, higher demands will also be placed on the transmission, that is, the grid. The large variations in production will also lead to that the margins in the system having to be increased, something we are already seeing in practice as reduced permitted transmission capacity on many links. All this points to a higher total cost for the wind scenario than for the nuclear scenario. Similar qualitative conclusions are drawn about the corresponding scenarios in another modelling/simulation, “Kraftsamling Elförsörjning”3 which is probably the most elaborate project to date for modeling and simulating the various alternatives.
As far as hydrogen production is concerned, the nuclear alternative will also be better, with more even production and less need for storage. The electrolysers, which will be a costly resource, are used to their full capacity, which makes the business case much better than in the wind power option when they are only used to 52%. Then we still haven’t addressed the fact that the heat from reactors can be used to make hydrogen production even more efficient. Most problematic in the wind power scenario, however, is the weather-dependent production of hydrogen that would require prohibitively large storage facilities to even out. At the national level, the industry simply has to adapt to the varying availability of hydrogen. This problem is not found in the nuclear option.
In conclusion, we can see that a simple balance model gives results close to significantly more advanced models and at the same time provides significant insights into what characteristics different scenarios offer. The two presented scenarios show major differences in behavior in terms of dynamic behavior, dependence on imports and storage and how hydrogen needs for industry, agriculture and transport can be satisfied. Then of course there are aspects that are not covered but that larger system models may handle, for example price development for electricity or optimization of the system with regard to total cost. However, even in large system models, these aspects are associated with great uncertainty.
A follow-up post will take a closer look at the balancing store needed to balance the 0.93 TWh deficit in the wind power scenario.
Description of the balance model
The model is implemented as a script in the Python programming language using the Pandas framework for data management and graphics. The active code is only about 100 lines, but they go a long way as we have seen. A run that covers two years or 17544 hours takes about 8 seconds on a computer with an Intel Core I7 processor, which makes it possible to easily vary and experiment with different parameter settings.
A balance model in this context means that for every hour throughout the year it is ensured that the production and consumption of electricity is balanced according to
Production + Import = Consumption + Export
As the model has no knowledge of the pricing on the electricity market that controls production, the balancing takes place according to a “merit order” sequence that looks like this:
- First, electricity is generated from “must run” sources. In the model, wind power, nuclear power and thermal power are examples of such. These produce a given amount of energy distributed over time.
- These “must run” sources are then balanced with electricity from flexible sources in several stages. First in order comes our hydropower, which is modeled here as a source that can freely generate between 2 – 13 GW of power.
- The next level of balancing is assumed to be flexibility through hydrogen production. In other words, if there is a surplus of electricity after balancing with hydropower, more hydrogen is produced, and if there is a deficit, less is produced.
- The fourth level is import and export. If the hydrogen flex is not enough to reduce consumption at low power production, balancing is covered by imports from abroad. In the same way, the surplus generated when the electrolyzer capacity is exceeded is exported.
- The last level is curtailment or deficit of power. This occurs when all flexibility is exhausted, that is when the import/export capacity is saturated.
This merit order is not perfect, sometimes we import electricity when it is cheap to save hydropower. This is never done in this model since water is always used first for balancing and import later. This may underestimate the electricity import somewhat, especially in the wind power option where hydropower is more important than in the nuclear power option. But it is still quite reasonable. For example, it is likely that we would rather produce hydrogen in strong winds than export the same electricity at a low price. It is also assumed that we would rather flex down hydrogen production than import electricity at a supposedly high price. So, by and large, the price mechanism is emulated with this merit order principle, which is also reflected in the results.
A number of parameters are set in the model and some are varied until energy balance is obtained, in this case we get a total consumption of 286 TWh, of which 85 TWh is consumed for hydrogen production. Unlike SvK’s model, it is assumed here that there is no solar power, only wind power, and that the power from thermal plants is at approximately today’s level, approx. 15 TWh distributed over the year with a sine distribution, that is more production in the winter and less in the summer. Above all, it is the scale factor4 for wind power data from 2020/2021 that is varied in such a way that hydropower receives an output of 67 TWh, corresponding to a normal weather year, at balance.
The consumption (except hydrogen production) is also assumed to be sinusoidally distributed over the year with a ± 4 GW difference in the daily average between winter and summer. No consideration has been given to the diurnal variation during a day, as we can assume that our flexible sources can handle this without problems. (From a power point of view, however, the diurnal variation can give an extra power need to be taken into account at, for example, the peak load hour). You can see these summer/winter variations quite easily for yourself by looking at the production and consumption data in, for example, SvK’s website “Control room”5. All together, this gives a model that is mathematically simple but still well reflects the physical reality. However, internal limitations are not taken into account, but the whole of Sweden is regarded as a “homogeneous” electricity area.
For those who want to experiment with different scenarios themselves, the model is available on GitHub6.
Model and simulation updated in several important aspects in this blog post.
Footnotes:
1) https://www.svk.se/siteassets/om-oss/rapporter/2021/langsiktig-marknadsanalys-2021.pdf
2) The number represents energy in, i.e. the energy used to create the hydrogen stored. It is important to indicate whether it is energy in or out that is meant, this is not always done. If, for example, electricity is to be produced back from this storage, only 10 GWh is obtained (at 40% efficiency electricity-gas-electricity).
4) Actual production data for wind power during 2020-2021 from ENTSO-E is thus scaled by simply multiplying the values hour by hour by a simple scale factor until the desired production is achieved.
5) https://www.svk.se/om-kraftsystemet/kontrollrummet/
6) https://github.com/beow/EnergyBalance (Models SvK_EF_wind.py, SvK_EF_nuclear.py)