
Bengt J. Olsson
Twitter: @bengtxyz
In the previous post, for the 286 TWh wind power scenario we concluded among others that we would get a deficit of about 0.93 TWh per year, even after significant flex from hydrogen production. In this post we will enhance the simulation by adding a separate balancing energy store that may resolve the deficit situation by providing extra power when needed. The simulation will indicate the size of the store, which will differ depending on the technology to realize it. We will also discuss what is actually needed in terms of facilities to realize such stores.
The question is, how large should this balancing energy store be? With a yearly deficit of 0.93 TWh we would expect that the actual store would be smaller since it would be drained and filled alternately. The sum of the repeated “drainage” would be 0.93 TWh but interspersed over time and thus only needing a smaller buffer store. One would think. But this is not the case as we will see. For two reasons
- Seasonal variations in the wind energy
- The low round-trip energy efficiency of the energy store
Let’s recapitulate the results from the wind power scenario in the previous post:
Prod power per year:          305.61 TWh
Load per year:                286.25 TWh
Produced water per year:       67.07 TWh
Produced wind per year:       221.60 TWh
Produced nuc/heat per year:    14.98 TWh
H2 production per year:        85.18 TWh
Cap. util. electrolyzers:      52.00 %
Curtailed per year             10.80 TWh
Deficit per year                0.93 TWh
Max shortage:                   7.40 GW
Max overshot                   32.40 GW
Import per year                 1.97 TWh
Export per year                 9.50 TWh
We can see that largest shortage or “dale” is 7.4 GW. Thus we need an energy store that can put out 7.4 GW to cover all power dales. On the other hand it is not economical to have this much output power. Let’s use 6 GW instead. It will not completely cover the dales but almost. Then we need to get energy into the store. For this we will iterate a couple of simulations to see what power is needed.
The balance equations in the model are altered like this: Before producing hydrogen from excessive power peaks, we produce energy for the balancing store. That is, the energy into the store lies between production from water and production of hydrogen in the “merit order” of balancing when we have excessive power. (See the previous post for a thorough discussion on the balance equations). This choice is made because the balancing energy store is relatively small in comparison with the energy needed for the general hydrogen production, but it is also quite important, making it justifiable to use the excess energy for this store before using it to produce hydrogen. As we will see, the power used for energy into the store is small in comparison with the electrolyzer power.
Correspondingly, when we have a shortage of power, we first reduce the production of hydrogen, the primary flex mechanism, and then use power from the balancing store to cover the remaining shortage. Let’s see how this play out in the simulation.
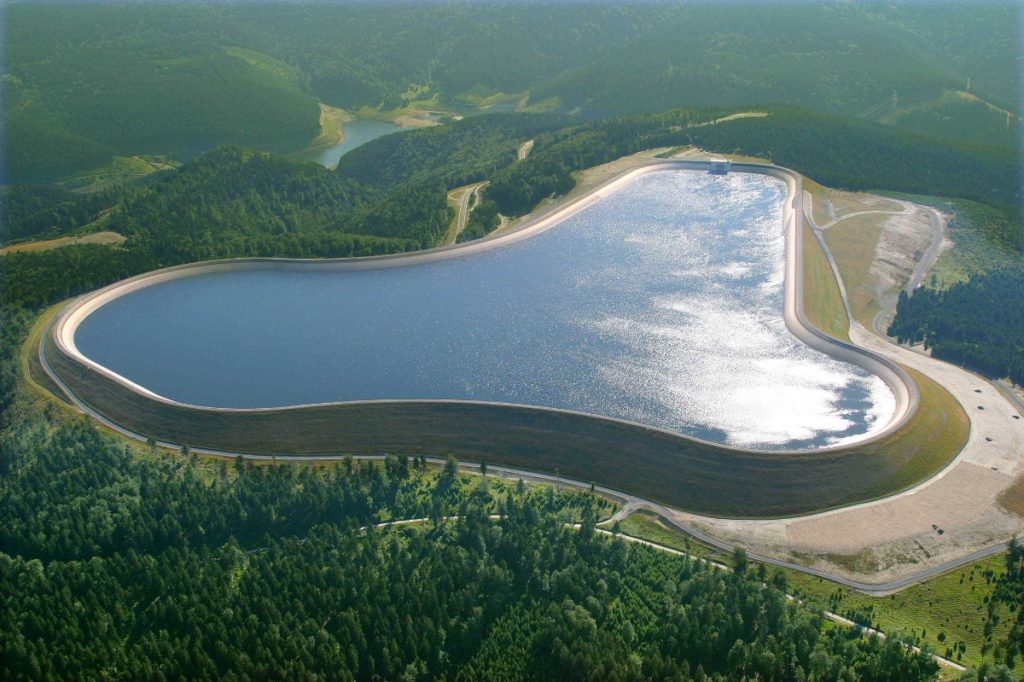
Pumped hydro energy store
First, we consider a pumped hydro energy store. Water is pumped up to an elevated reservoir when we have excessive power, and then when we instead need extra power, energy stored in the reservoir is released by reversing the water flow down from the reservoir and drive a turbine. Let’s assume that the round-trip efficiency for pumping-storing-generating power is 80%. (It is not possible to utilise all pump power to elevate the water, in the reservoir it may evaporate etc.)
We already stipulated that the generator (turbine) power needs to be 6 GW so it is clearly a very large pumped hydro station, or there are a number of smaller stations. By running the simulation a number of times, testing different power-in settings (corresponding to the pump power of the station), we can see that we get a balanced energy store by using 0.36 GW or 360 MW pump power.
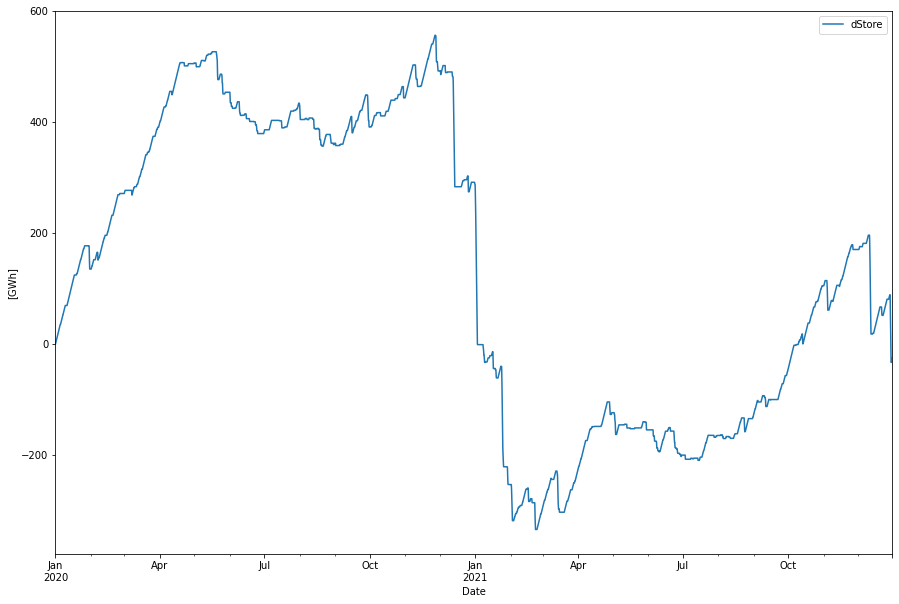
Prod power per year:          305.61 TWh
Load per year:                285.80 TWh
Produced water per year:       67.07 TWh
Produced wind per year:       221.60 TWh
Produced nuc/heat per year:    14.98 TWh
H2 production per year:        84.74 TWh
- From excess power:           23.26 TWh
- Within consump. profile:     61.48 TWh
Cap. util. electrolyzers:      51.73 %
Curtailed per year             10.36 TWh
Deficit per year                0.01 TWh
Max shortage:                   1.40 GW
Max overshot                   32.04 GW
Import per year                 1.97 TWh
Export per year                 9.25 TWh
From the table we see that the deficit is down to 0.01 TWh (from 0.93 TWh). With 6 GW of production power from the store, the largest dale is now 7.4 – 6 = 1.4 GW. Hence, we are not fully recovering from the deficit but almost.
From the picture we see that the pumped hydro storage must have a size of about 0.9 TWh which is bigger that we would anticipate. This is because we have weak winds and high consumption during December 2020 and January 2021. The store is constantly drained, with no time to recover, during this period.
Also, the round-trip efficiency will play a role for the size of the storage as we will see next.
Hydrogen energy store
Here we will instead use a hydrogen energy store to balance the power deficit. We need electrolyzers that produce hydrogen for the store and 6 GW of gas turbines to produce power from the store. In this case we assume 40% round trip efficiency, which is on the high side for this process, but let’s use it anyway.
The same iterative approach with testing different input powers now yields the following storage graph, when using 730 MW of electrolyzer capacity. (The extra 0.73 GW should be compared to the 18.7 GW of electrolyzer capacity we already have).
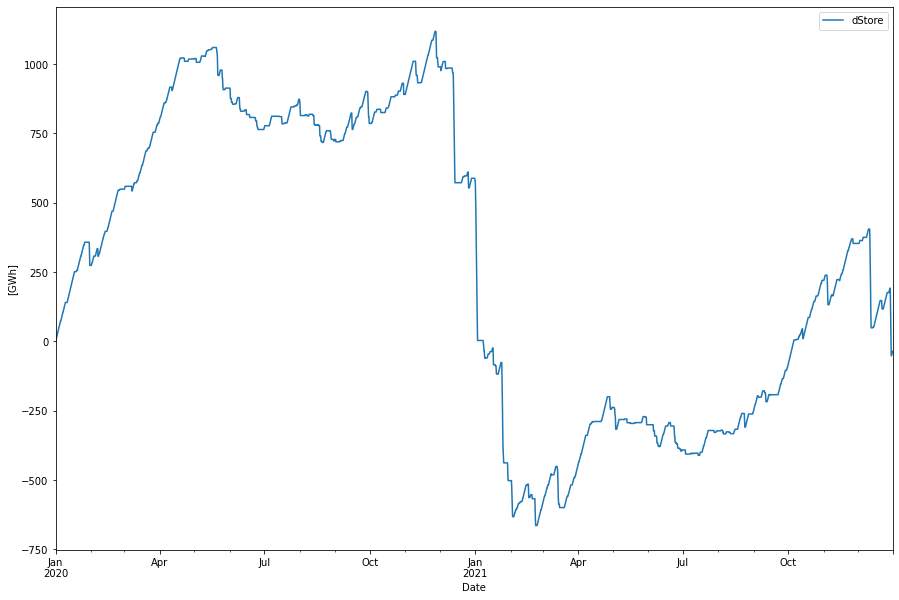
Prod power per year:          305.61 TWh
Load per year:                285.35 TWh
Produced water per year:       67.07 TWh
Produced wind per year:       221.60 TWh
Produced nuc/heat per year:    14.98 TWh
H2 production per year:        84.28 TWh
- From excess power:           22.81 TWh
- Within consump. profile:     61.48 TWh
Cap. util. electrolyzers:      51.45 %
Curtailed per year              9.91 TWh
Deficit per year                0.01 TWh
Max shortage:                   1.40 GW
Max overshot                   31.67 GW
Import per year                 1.97 TWh
Export per year                 8.99 TWh
We now see that the store fill level is similar in form but its size has now grown to about 1.7 TWh. This is because of the low round trip efficiency for power-hydrogen-power. The table above show very similar values. A small change in produced hydrogen can be spotted, since the higher power into the store (the 730 MW electrolyzers) leaves a little less of the power peaks for to produce hydrogen (for industrial purposes).
Below we have the same expanded graph for January 2021 as in the previous post, but now with the energy store contribution added.
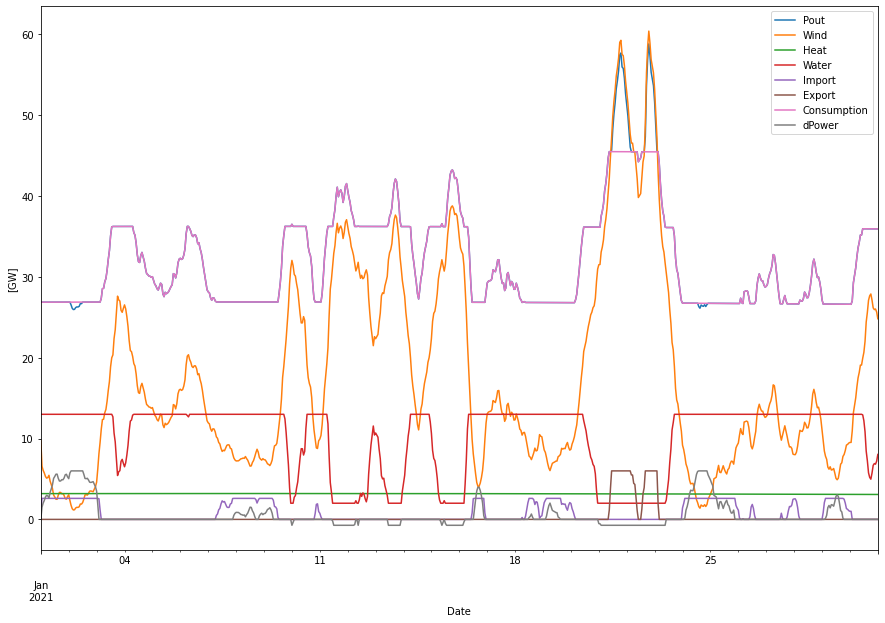
The grey “dPower” line adds power at the deficit times, as can be seen that the “un-matched” blue power line (Pout) has almost disappeared. We can also see the negative contribution of power when the store is charged (here with up to 730 MW).
Energy stores in practice
The stored energy numbers are rather abstract. Let’s see what they really mean in the context of a smaller country like Sweden
Pumped hydro store
The requirements of the pumped hydro store were in short
- Pump power of 360 MW
- Generation power of 6 GW
- Storage capacity of 900 GWh
Let’s compare with the biggest pumped hydro facility Sweden has had. It was the Juktan power station1 that was operational as a pumped hydro facility between 1978 and 1996. It had a storage capacity of about 30 GWh (which is fairly big, the largest pumped hydro facility working today is the Fengning facility in China that can store 40 GWh).
Juktan had a generation capacity of about 300 MW and a pump capacity of 250 MW. Hence the pump capacity is fairly well matched to the need above, but the generation power and storage capacities are much too low. We would need about 30 Juktan facilities to serv the need.
Hydrogen store
For the hydrogen alternative the balancing requirements were
- Electrolyzer capacity of 730 MW
- Generation power of 6 GW
- Storage capacity of 1.7 TWh
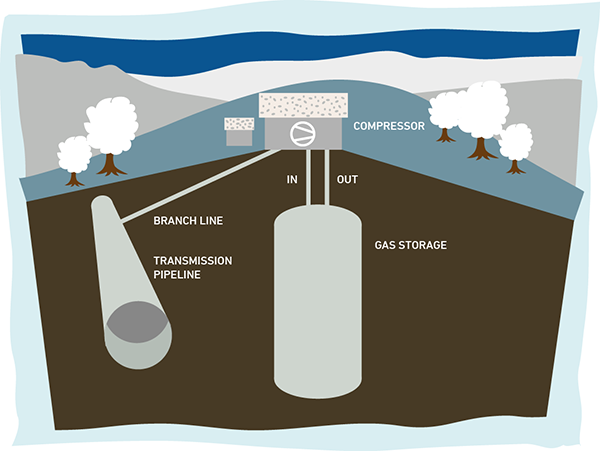
Sweden does not have the natural conditions for large scale hydrogen storage in form of salt caverns or aquifers. A possible solution is to use Lined Rock Caverns (LRC) that are rock caverns lined with a gas-tight metal sheet layer. I Sweden we have one large such facility, the “Skallen” natural gas storage facility2. Natural gas is easier to store than hydrogen since it less reactive with metal lining, and also does not escape as easy as hydrogen. But let’s assume we could use it for hydrogen storage.
Skallen has a working gas volume of 32.000 m3 and a pressure of 200 bar. The density of hyrogen at that pressure is 15 kg/m3, which gives us working capacity of 480.000 kg hydrogen in the store. To produce this amount of hydrogen, at 50 kWh/kg H2, 24 GWh electric energy is needed.
Hence we would need about 70 Skallen facilities to cover our storage need.
We can see that both these alternatives are un-realistic for a country like Sweden. Finding 30 places for pumped hydro of the size of Juktan would not be possible, both from an ecological perspective as well as for the cost.
The same goes for the hydrogen stores. The Skallen LRC facility is probably the only one of its kind and size in the whole world. In Sweden the iron and steel industry is looking at building even larger LRCs than Skallen, but not at all in the quantity to serve the 1.7 TWh need.
Conclusion
As we have seen in the previous post, the model predicts a deficit in the order of one TWh yearly for the 286 TWh wind power scenario. This is after hydrogen production flex, that is, with no hydrogen production at all in power shortage situations. Other flexibility possibilities are very small in comparison to the hydrogen production flex and can hardly help up the deficit situation.
Here we can see that the size of the balancing energy store does not become smaller than the total deficit of 1 TWh, which you would expect, but may grow significantly larger depending on the seasonal wind patterns and the round-trip efficiency of the energy store.
We have also shown that the challenges to build such energy stores in practice are overwhelming for a country like Sweden. And then we’re still blessed with having a large share of our power supply from flexible hydro power. Without the hydro power, the storage needs would be massive in the wind power scenario.
The model is available on GitHub, see previous post.