
Bengt J. Olsson
Twitter: @bengtxyz
From the previous two posts we have a balance model of Swedens power system, with and without a deficit energy store. It models a scenario depicted by Swedish TSO Svenska Kraftnät (SvK) as “Renewable Electrification” (“Elektrifiering Förnybart”; EF) that comprises 286 TWh consumption by 2045, out of which 85 TWh are for industrial hydrogen production. It is assumed that this latter production is fully flexible and can be adjusted down as demanded by the power availability. The model provides results well in line with SvK’s own, much larger model.
It is fairly easy to change the parameters of this model for a similar scenario in which Sweden have no balancing hydro power at all. This is a purely hypothetical scenario, but interesting to investigate. Many countries are not as blessed with hydro power as Norway and Sweden. Hence the results will indicate the challenges at hand when not having balancing hydro power.
Without energy store
So let’s start! First without any deficit store in order to estimate the deficit. We set the hydro power capacity to zero in the model and tune the wind power scaling until we get a “balanced” power mix that serves the 286 TWh load and produces 85 TWh of hydrogen yearly. For this we need approximately 11.3 times the wind power production vs 2020/2021. Result of the number crunching looks like this
Prod power per year:          333.50 TWh
Load per year:                286.06 TWh
Produced water per year:        0.00 TWh
Produced wind per year:       311.89 TWh
Produced nuc/heat per year:    14.98 TWh
H2 production per year:        85.00 TWh
- From excess power:           36.10 TWh
- Within consump. profile:     48.90 TWh
Cap. util. electrolyzers:      51.89 %
Curtailed per year             46.18 TWh
Deficit per year               16.17 TWh
Max shortage:                  20.13 GW
Max overshot                   61.42 GW
Import per year                 6.65 TWh
Export per year                17.42 TWh
A whopping 312 TWh of wind power is needed together with the present 15 TWh from heat and about 6.6 TWh of import to serve the load. The import limit of 2.6 GW is kept from the previous posts, see the discussion on import there.
We can see that Curtailed + Export amounts to about 63.6 TWh. Here the curtailed part is 46 TWh, but if we could export more then curtailment would be less and vice versa. (Probably we would export less and curtail more).
We have the same electrolyzer capacity of 18.7 GW as in the previous posts. We get overshots of up to 60 GW! And deficit peaks of about 20 GW.
But most interestingly, the aggregated deficit becomes around 16 TWh (up from 1 TWh when we had hydro power). This is the result after loosing 67 TWh of flexible hydro energy which have been replaced with about 90 TWh inflexible wind power.
Anyway, this doesn’t balance so it will not work in practise. A deficit of 16 TWh with residual loads of up to 20 GW will be detrimental to the society. Hence we need to run the model with the energy store included.
With energy store
In this case we chose a hydrogen energy store, with a roundtrip efficiency assumed to be 40% power-hydrogen-power. In the simulation this will require 7.5 GW more electrolyzer capacity and 18 GW of hydrogen combined cycle turbines. We need to add additional wind power (which is the only power component we can change) in order to produce the energy for the deficit store. The result after some iterations becomes the following
Prod power per year:          368.61 TWh
Load per year:                286.17 TWh
Produced water per year:        0.00 TWh
Produced wind per year:       347.95 TWh
Produced nuc/heat per year:    14.98 TWh
H2 production per year:        85.11 TWh
- From excess power:           32.24 TWh
- Within consump. profile:     52.87 TWh
Cap. util. electrolyzers:      51.96 %
Curtailed per year             46.20 TWh
Deficit per year                0.01 TWh
Max shortage:                   2.02 GW
Max overshot                   66.31 GW
Import per year                 5.70 TWh
Export per year                16.10 TWh
The windpower has now increased to 348 TWh, 36 TWh more than without the store, and 126 TWh more than the 67 TWh water we replaced. Curtailed energy is about the same, since we now use more of the excess power peaks to produce hydrogen for the energy/deficit store, and most importantly, the deficit is now down to zero.
Let’s have a look on how the power dispatch looks like during Januari 2046 in this two-year model:
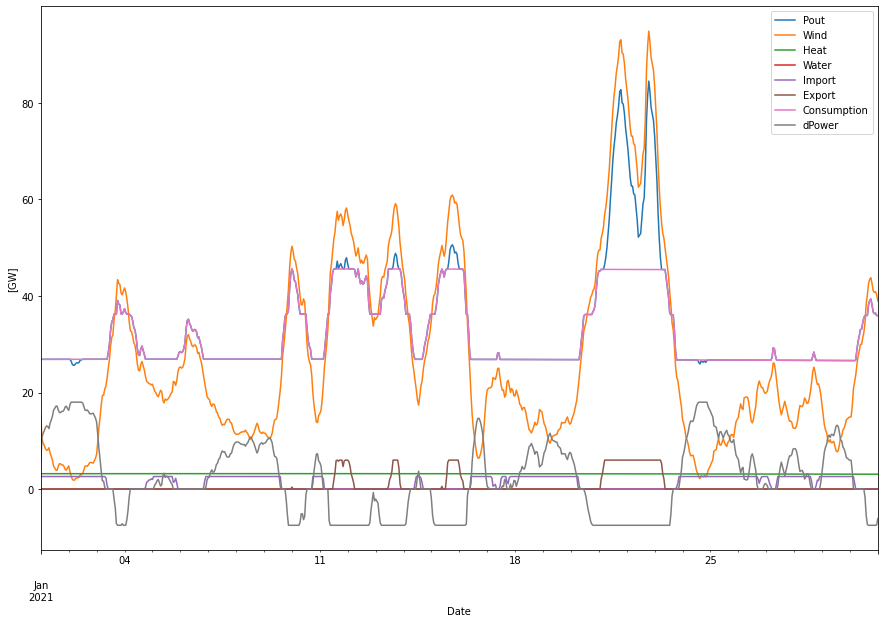
We can see that power dispatch (blue line) meets the consumption (cerise line) at all times (except during some minor deficit events). The area between the blue and cerise lines is curtailed energy. We can also see the grey energy store power line both dispatch power in shortage situations and as a negative dispatch when it charges the store in excessive power situations.
Now to the big question! How large must the energy stor be? As mentioned above it is charged with up to 7.5 GW electrolyzer capacity (in addition to the 18.7 GW capacity for industrial hydrogen) and is discharged with up to 18 GW of CCGT capacity. The result can be seen below.
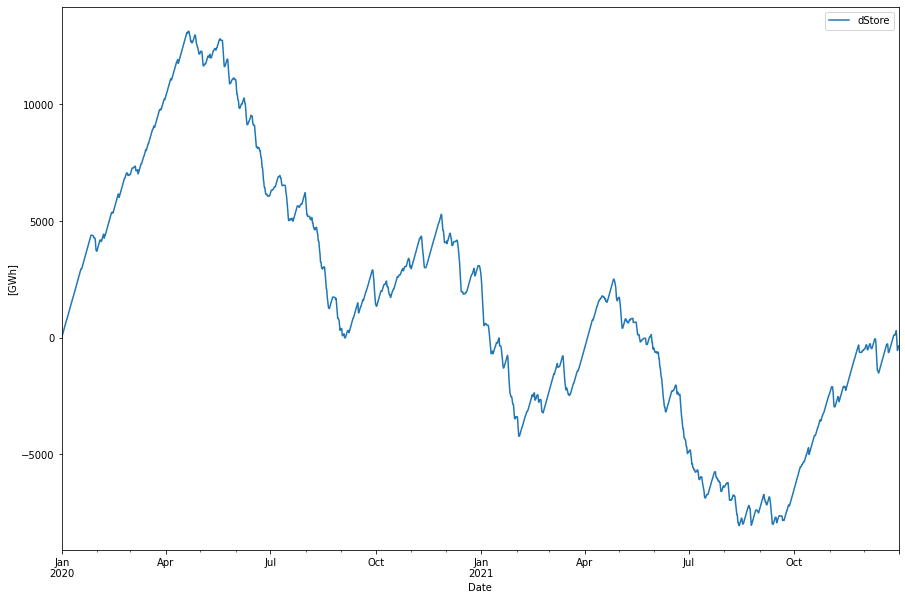
The store size is of the order of 20 TWh (measured from peak of the curve to its minimum). It also has this interesting two-year cycle, it is charged during windy conditions the winter of 2045 and then continuously discharged and not being able to recover during the low wind conditions of the 2046 winter.
Again we see that mult-year wind patterns must be considered when dimensioning large scale energy stores.
How much is the 20 TWh of energy store? It could be compared with the hydro power magazines of Sweden that are about 33 TWh in size. Pretty large, but then we’re also replacing this hydro power with hydrogen combustion energy. If we compare it with the largest natural gas LRC storage we have in Sweden (and probably in the world), Skallen, that can house 24 GWh of hydrogen energy (see previous blog post) we would need around 830 of these facilities! Together with the 18 GW hydorgen gas turbines and 7.5 GW of electrolyzer capacity, just to cover the deficits.
We should be very happy of having this great resource, the Swedish hydro power!