
Bengt J. Olsson
Twitter: @bengtxyz
LinkedIn: beos
Fixed cases
Cost optimized cases
Result
Conclusions
Updates
– Wärtsilä case
This tweet created some waves on X. Let’s look at the details.
The background was this post on LinkedIn by Michael Caravaggio : https://www.linkedin.com/posts/michael-caravaggio_a-colleague-asked-me-based-on-the-last-5-activity-7197421216071041024-cI_c
In the post Michael presents, upon a question from a colleague, an answer to the question: “How many GW of wind + solar + MWh of storage would be needed to deliver a continuous 1GW of Carbon Free Energy for every hour in the period” based on ERCOT (Texas) data for wind and solar the latest 5 years. For 3 GW of installed capacity of both wind and solar power, Michael calculates a value of 57 GWh for the store.
I thought this was an interesting exercise and set up the same calculation using wind and solar data I already had for 2021-2023, that I used in the previous blog post. Instead of a generic store, I used a battery store with a round-trip efficiency of 80%. (Michael used an ideal, zero-loss storage approach).
NOTE!!!: The arrangement represents by no way a real power system solution, it is merely a thought experiment to compare the different conditions a sunny Texas versus a colder and darker Sweden presents for weather dependent power sources. The exercise is only intended to contribute to the general perspective. Nothing more.
The 3 + 3 GW wind + solar power system with Swedish capacity factors, here defined as 30% for onshore wind and 10% for solar, produces only 3*(0.3+0.1) = 1.2 GW in average. This is only 20% in overproduction vs the target 1 GW. As a result, quite a lot of battery storage is needed, around 550 GWh. This is almost 10 times more than what is needed in the ERCOT case. The largest influence has of course the lower capacity factors I use. Michael communicated to me that his average capacity factors were 35% and 24% for wind and solar respectively. Thus the ERCOT case presents an overproduction of 77%, which holds down the need for storage. However 57 GWh is a hefty amount also…
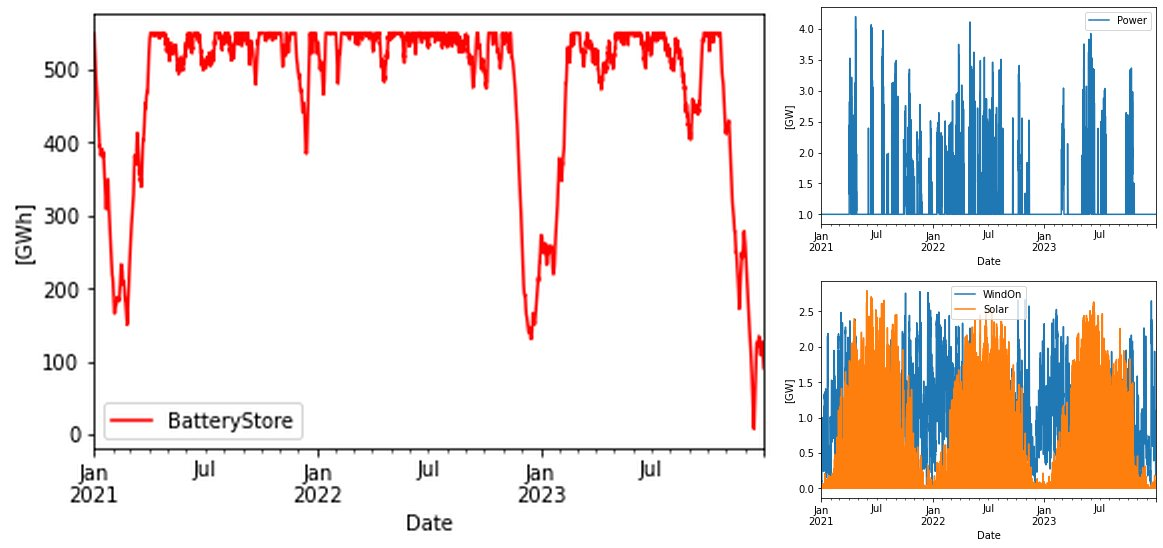
drains the battery storage.
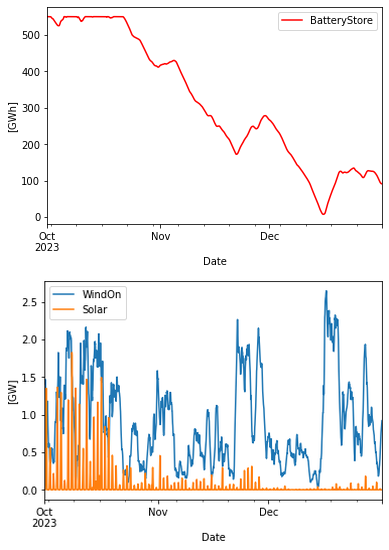
It can be seen that the limiting factor for the Battery storage is the “Dunkelflaute” period in November-December 2023. It is certainly dark in Nov/Dec in Sweden…
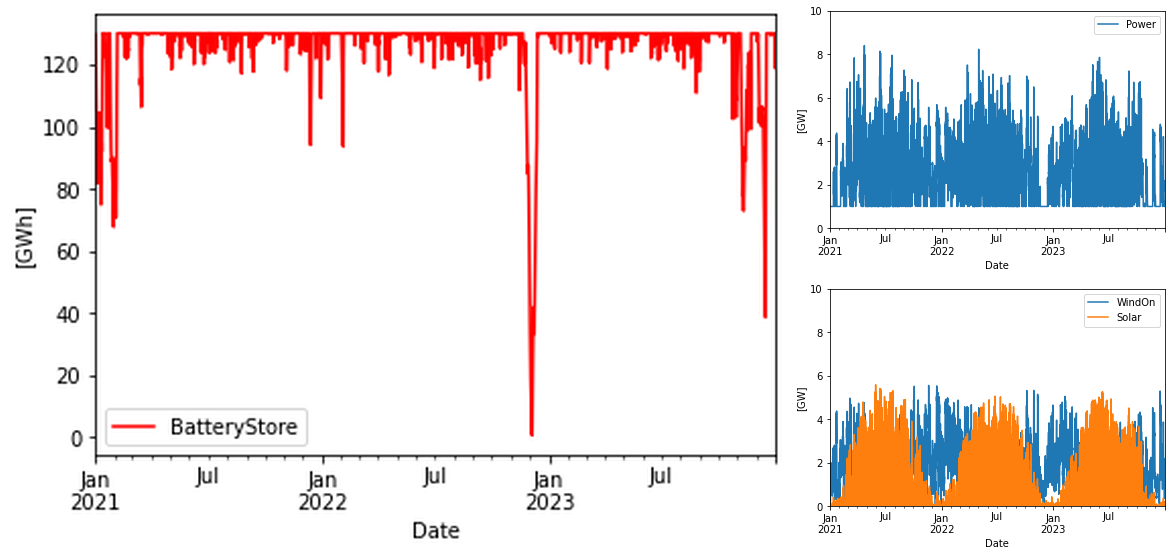
If we instead double the power to 6 + 6 GW, the average power produced becomes 2.4 GW, that is an over-build by 140% vs the 1 GW target. This eases the need for battery storage down to about 130 GWh, which is still twice of what is needed in the ERCOT case. And this with a higher overbuild.
Cost-optimal mix
As noted above, 3 + 3 GW wind + solar to produce 1 GW of firm power using battery storage for backup is not cost-optimal due to the low capacity factors for especially solar power on the northern Swedish latitudes. Thus we extend the experiment by adding a cost optimization to the model. For this we need a lot of assumptions on the involved costs. There will never be an agreement among proponents of different power system solutions, of what the “right” costs are. Here I use costs that in my view are very aggressive in favor of renewable power sources and storage.
| CAPEX [MUSD/GW] | OPEX [MUSD/GW/year] | Lifetime [years] | |
|---|---|---|---|
| WInd power | 1000 | 20 (2%) | 25 |
| Solar power | 300 | 6 (2%) | 25 |
| Battery | 100 (per GWh) | 1 (1%) | 15 |
| Hydrogen CCGT | 850 | 8.5 (1%) | 30 |
| Electrolyzers | 500 | 15 (3%) | 15 |
| Hydrogen storage | 2 (per GWh) | 0.06 (3%) | 40 |
For all resources a 6% discount rate is used. By annualizing the cost components for all resources, adding them together, and divide the sum by the produced amount of power per year, a System LCOE is obtained. Two values of the System LCOE are provided, one where the produced power equals the target 1 GW, that is a total of 8.76 TWh per year. The other value is when also the excess energy is included in the calculation. The correct answer will depend on how much of the excess energy that can be used to meet the load. It is likely that the correct value would be somewhere between the two provided values. The System LCOE is a good measure since it internalizes the costs for storage, and also for the overproduction of energy.
With the data above, and the capacity factors 30% and 10% for wind and solar respectively the component LCOE for wind and solar become:
Wind power: 37.4 USD/MWh
Solar power: 33.6 USD/MWh
Again, I consider the above cost numbers as very optimistic future values.
Cost-optimal mix wind+solar+batteries
Using a Nelder-Mead algorithm to find the cost optimal solution for the mixed wind + solar + batteries, the system looked like this:
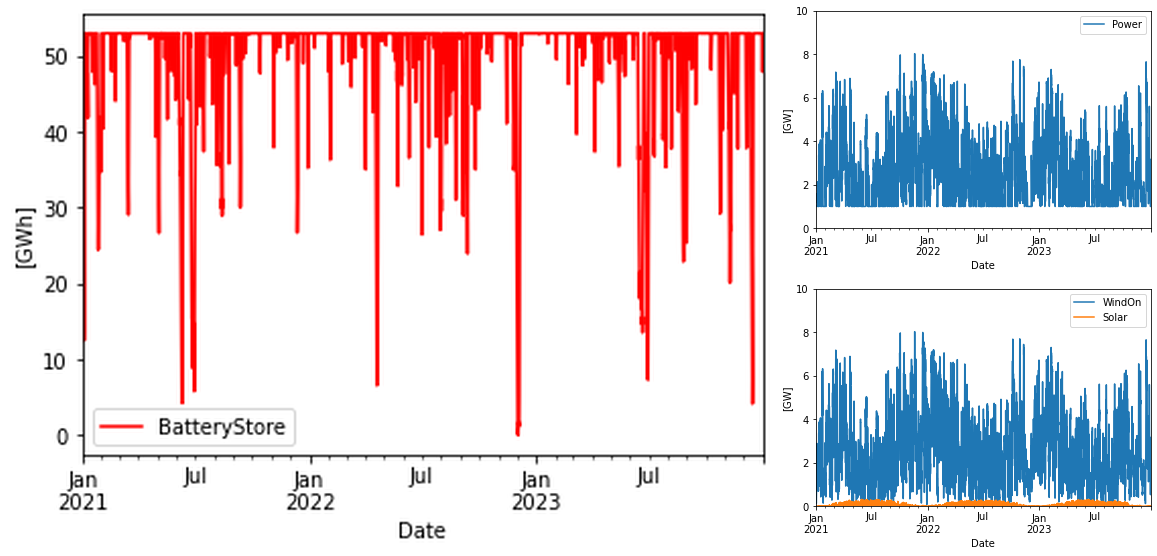
As can be seen, solar power is almost entirely squeezed out of the system, since it would be very expensive to store solar energy from the summer season to the winter season.
Cost-optimal mix wind+solar+hydrogen
The use of batteries for Long Duration Energy Storage (LDES) is not optimal, they are designed for daily charge/decharge cycles. They are also very expensive when storage in bulk is needed. More realistic would be to use hydrogen storage (in lack of reservoir hydro of course), paired with electrolyzers for producing hydrogen when power above 1 GW is available, and hydrogen combined cycle gas turbines (CCGT) generators that combusts hydrogen from the hydrogen store in order to produce electricity. CCGT is used since it has a higher efficiency than for example a single cycle gas turbine. The latter may react faster to changes, but the round-trip-efficiency power-gas-power will be sacrificed.
If we use “standardized” numbers, that is
- Electricity needed to produce hydrogen: 50 kWh/kg
- LHV (lower heating value) energy in 1 kg H2: 33.3 kWh/kg
- Electricity produced by the hydrogen CCGT: 20 kWh/kg
we get a round trip efficiency of 20/50 = 40%. Efficiency in the production process becomes 33.3/50 = 67% and in the generation process it is 20/33.3 = 60%.
The cost-optimal mixed with wind+solar+hydrogen became:
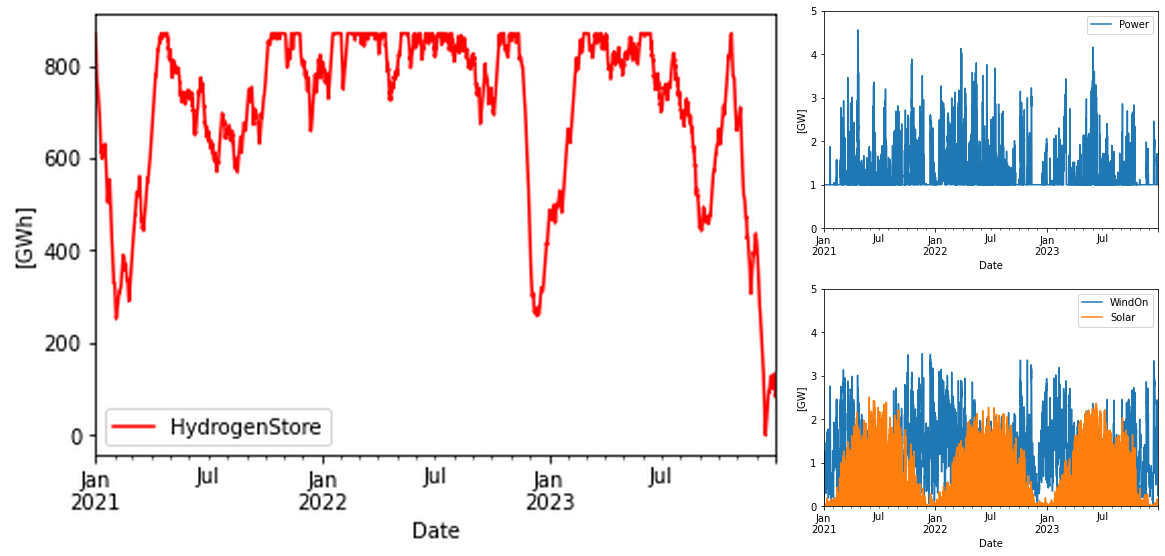
Cost-optimal mix wind+solar+hydrogen with fixed storage size
A 884 GWh hydrogen storage is incomprehensible in a country like Sweden that lacks the geological conditions for salt caverns or aquifers. We could instead compare with the Swedish steel company LKAB that hints that they would need a 100 GWh storage for a production facility consuming about 1 GW of power. The 100 GWh storage is approximately 4 times bigger than the presently largest LRC (Lined Rock Cavern) in the world, “Skallen” in southern Sweden. Note that this storage is for natural gas.
Fixing the storage to 100 GWh (67 GWh LHV) the following solution is obtained. It looks similar to the battery case because the storage is of similar order. Somewhat more total energy needs to be provided than in the battery case in spite of a larger storage. This can be attributed to the worser round-trip efficiency for hydrogen vs batteries. Results in table below.
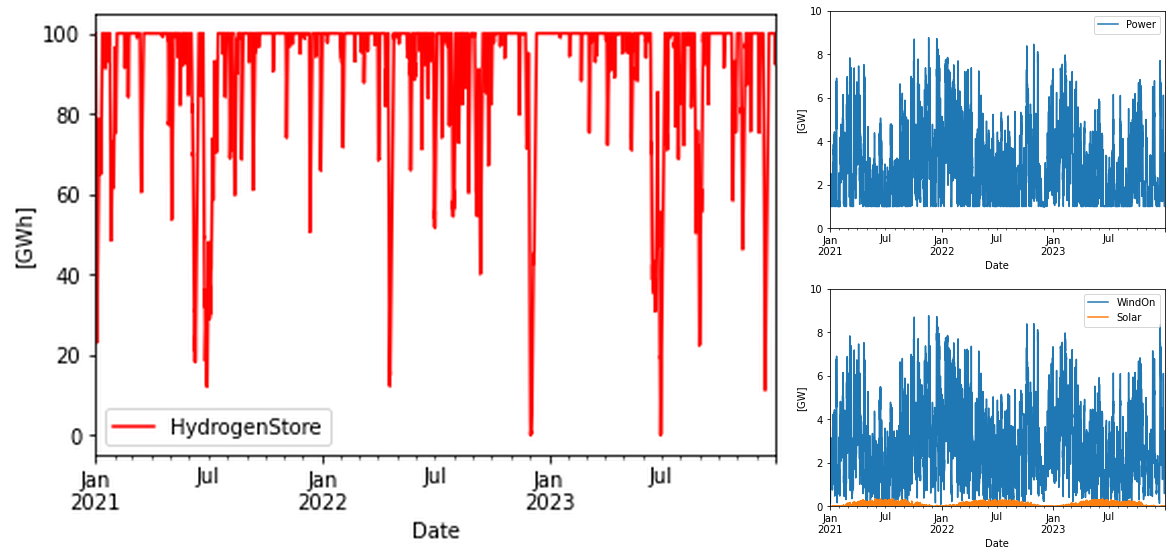
Result table
Here are the System LCOE costs and other data for the different scenarios.
| Case | System LCOE, 1 GW [USD/MWh] | System LCOE, all power [USD/MWh] | Over-production | Wind power [GW] | Solar Power [GW] | Energy Wind/Solar | Battery [GWh] | Hydrogen LHV [GWh] | Electrolyzer [GW] |
|---|---|---|---|---|---|---|---|---|---|
| 3 + 3 GW with batteries | 744 | 634 | 20% | 3 | 3 | 75% Wind 25% Solar | 543 | – | – |
| 6 + 6 GW with batteries | 255 | 107 | 140% | 6 | 6 | 75% Wind 25% Solar | 130 | – | – |
| Battery optimized | 167 | 64 | 164% | 8.67 | 0.34 | 99% Wind 1% Solar | 53 | – | – |
| Hydrogen optimized | 85 | 69 | 41% | 3.79 | 2.70 | 81% Wind 19% Solar | – | 589 | 0.88 |
| Hydrogen optimized w. fixed storage size (100 GWh) | 120 | 43 | 187% | 9.46 | 0.37 | 99% Wind 1% Solar | 67 | 0.64 |
Conclusions
What can we learn from this exercise? Again, this is not a proposal of how to build firm power from wind and solar power. The power system is immensely more complex with numerous interacting parts that together make the total solution. But just the sheer complexity of the full power system makes these kind of seizable model studys the more interesting.
Some observations
- The low capacity factor and seasonal variations of solar power makes it a relatively small part of the solution on higher latitudes. Especially when storage capacity is expensive (that is, batteries) the share of solar becomes negligible. The conditions for ERCOT in Texas is probably much more in favor for solar power.
- Wind power provides the lion share of the energy. Wind has a more even production pattern over the year with less storage need.
- The storage cost is a large part of the System LCOE. In both the optimized cases storage consumed about 40% of the System LCOE, and production 60%. This is BTW why you can’t look at wind and solar LCOE by themselves. In the non-optimized cases the storage share of the System LCOE was much larger.
- Hydrogen constitutes a more realistic alternative than batteries for this kind of bulk storage.
Now we have only considered at fixed 1 GW output from the system as target, all year around. On northern latitudes also the demand increases in the winter, making solar an even less desirable part of the solution due to the seasonal variations here. For an analogy, just look at a typical house in Sweden with solar panels. In the summer you could maybe handle the daily variation with solar panels and a sizeable battery. But in the winter, there is no size of battery that, together with the (almost absent) solar power, can provide anywhere near what is needed for the house. Then you fully have to rely on other power sources. Seasonal storage must become very cheap for solar to make sense on a national scale on northern latitudes. In Sweden, with a lot of hydro power it can be argued that solar power can offset hydro power in the summer, such that more hydro power is available during the winter. I’m not sure how strong that argument is, and in many countries hydro reservoir power is not an option for bulk storage.
About the hydrogen storage: in a real power system model, most of the flexibility from hydrogen would come in form of production flexibility and not “combustion” flexibility. This is also a healthier form of flexibility that doesn’t pay the high round-trip efficiency tax that hydrogen combustion in CCGTs do. But production flexibility requires that the main part of hydrogen should be used as feedstock for industrial processes, and not only for balancing the power system. This fact also makes the model un-realistic from a real power system perspective.
Updates
2024-06-02
The Wärtsilä firm power provisioning case described here fundamentally mirrors the previous use case. Here, the above methodology is applied, allowing the inclusion of costing information. Let’s examine the results. Note that this isn’t a cost optimization exercise; it employs the actual values proposed by Wärtsilä.
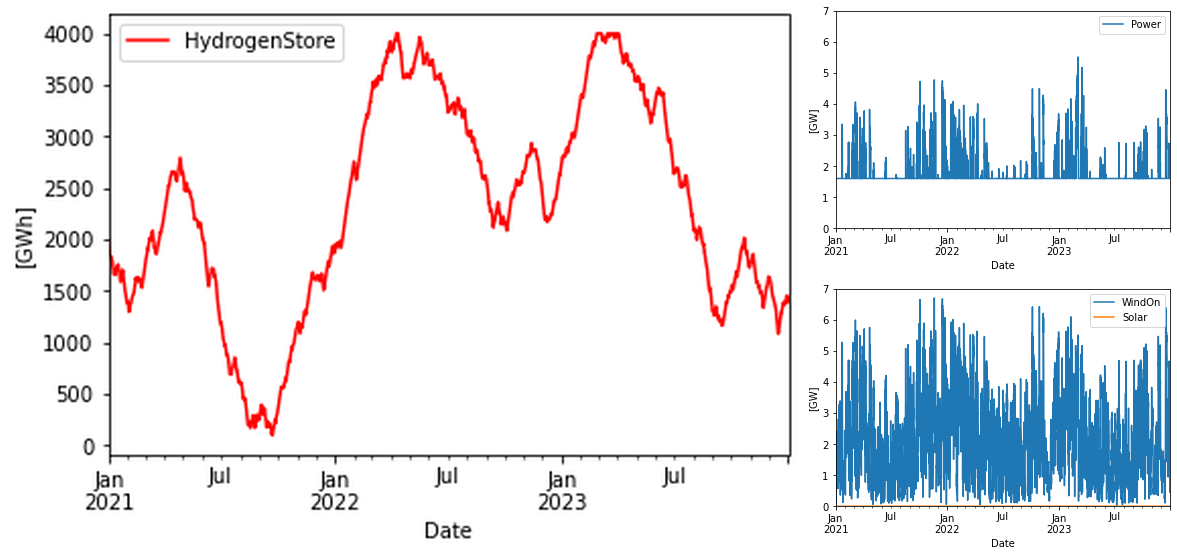
A whopping 4 TWh of storage is needed for guaranteeing at least 1.6 GW power out. This was the conclusion also in the former model. 2021 was a bad wind year and 2022/2023 behaves more like 2020 in this respect, and hence the same storage need was found also in this model.
Interesting is to inspect the LCOE values. From the Helsingin Sanomat article no input cost values were presented. But is is stated that the LCOE became 64 EUR/MWh for the solution. Now in my model this corresponds very well with the values I get for the case when all output energy can be used, and storage costs are not included, 61 USD/MWh. Here is the table
| System LCOE | With storage costs | Without storage costs |
|---|---|---|
| For 1 GW firm power [USD/MWh] | 197 | 109 |
| For 1 GW firm power + excess power [USD/MWh] | 111 | 61 |
It appears that Wärtsilä utilized similar cost figures to those I have used, yet they excluded the storage costs. They likely accounted for all the delivered energy, not solely the 1 GW base power, in their LCOE calculation. However, their model does not seem to take storage into account, despite its significant influence on the overall solution.