
Bengt J. Olsson
Twitter: @bengtxyz
The balance model described in this earlier blog post is very versatile for testing and evaluating different power mix scenarios. In this post we will return to the year of the included wind data which is kind of key to the model. We will look at some aspects of the model applied to Sweden 2020 and 2021. These years are interesting since they are relatively close in time to now. They also provide a wind pattern that “stress test” the scenarios a bit since there was unusual low wind between December 2020 to January 2021. This shows that not only seasonal patterns should be examined, but also multi-year patterns.
Scenario: Sweden 2020-2021
Lets take a look at the model’s simulation of these years. All yearly numbers provided are the average of the two years. The energy balance data come from this link. Here is the simulation:
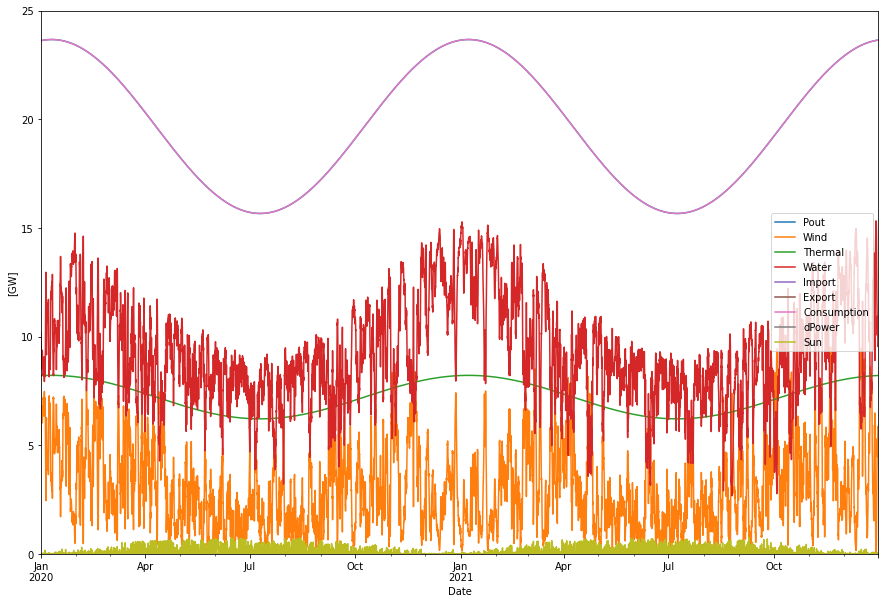
Supplied power per year:      172.73 TWh
Consumption per year:         172.73 TWh
Produced hydro per year:       80.84 TWh
Produced wind per year:        27.53 TWh
Produced sun per year:          0.93 TWh
Produced nuc/bio per year:     63.42 TWh
Average supplied power per year was 172.7 TWh. This includes produced power as well as imported power. In this model it is hard to distinguish between supplied hydro and imported power, since it used a strict “merit order” approach where balancing first is done with hydro power and if balance is not achieved, import or export is “dispatched” (and if no balance after that we have a deficit or curtailment situation). In real life however, the hydro power delivery is inter-mixed with import in a way that is hard to simulate. But we can improve the model to take this into consideration to a quite high degree, we’ll see that later.
The consumption balances the supplied power as can be seen. In this scenario where we “deliberately” over-produce power in order to export energy, we must include the export into the domestic consumption, just like any other consumption. Normally, in a balance model like this, import and export would solely be the result of avoiding deficits or curtailment as described above, but Sweden has an excess of energy production (a deliberate “un-balance”) that requires this special treatment in the model.
This means that the consumption in this model really consists of 137.3 TWh domestic usage and 25.3 TWh of export (average values).
We can see the contribution from the different power sources as well. Nuclear + bio power supplied approximately 49 + 14 TWh yearly, there was a small contribution from solar power and 27.5 TWh from wind power (interestingly almost exactly the same energy for both years in spite an addition of some 20% more installed wind power in 2021).
Now the hydro power number is actually the combined number from hydro and import. The actual hydro + import numbers where 70.9 + 10 TWh. We will below look at a way to better describe hydro + import in the context of Sweden.
The model uses simplified functions for describing the consumption and production of nuclear/thermal energy. Both these are approximated with sinus functions with maximum during the winter and minimum during summer. The rational for this is that the energy consumption is very much weather dependent and the temperatures vary very much with this sinus shape. Also nuclear/thermal is adapting to some degree to this shape in order to balance the power dispatch with the varying consumption. Typically nuclear maintenance stops occur during the summer. But the average value of these sinus curves conforms to the actual yearly production/consumption.
Daily consumption variation
Likewise, no daily variation in the consumption is included in the model. This is because the daily variations is easily handled by the hydro power and does not really affect the balance situations (other than adding hours during day or night that could be troublesome from a peak power perspective). If we include a ± 2.5 GW sinusoidal daily variation curve on top of the consumption curve and run the same simulation we get the following graph:
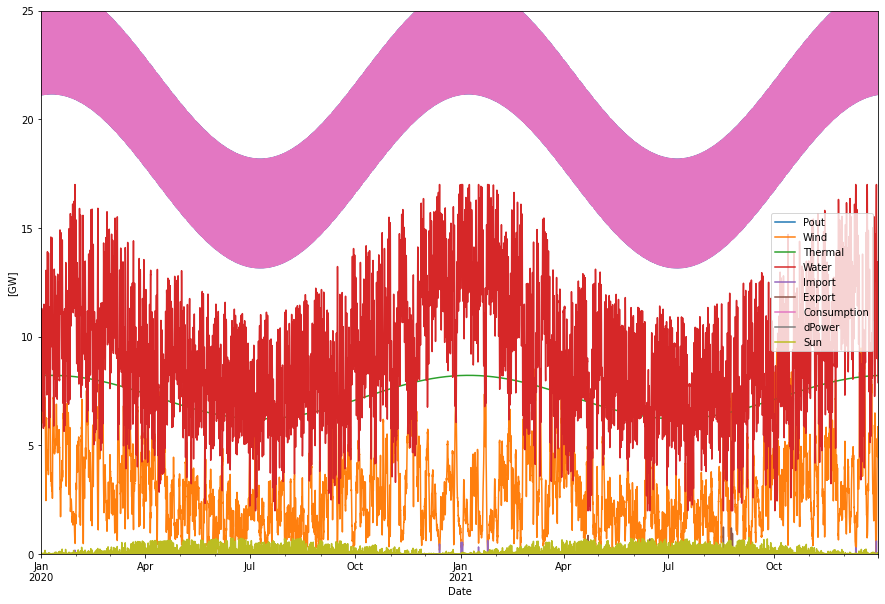
Supplied power per year:      172.74 TWh
Consumption per year:         172.73 TWh
Produced hydro per year:       80.85 TWh
Produced wind per year:        27.53 TWh
Produced sun per year:          0.93 TWh
Produced nuc/bio per year:     63.42 TWh
The main difference is that the hydro curve is now “wider” since it includes the daily variations as well. But as expected there is no difference in the energy balance numbers. Since the daily variation contain little information we will use the averaged consumption curves instead, providing a less cluttered view of the results.
Combined Swedish hydro + Norwegian import model
The red hydro curve above actually agrees quite well with this curve below.
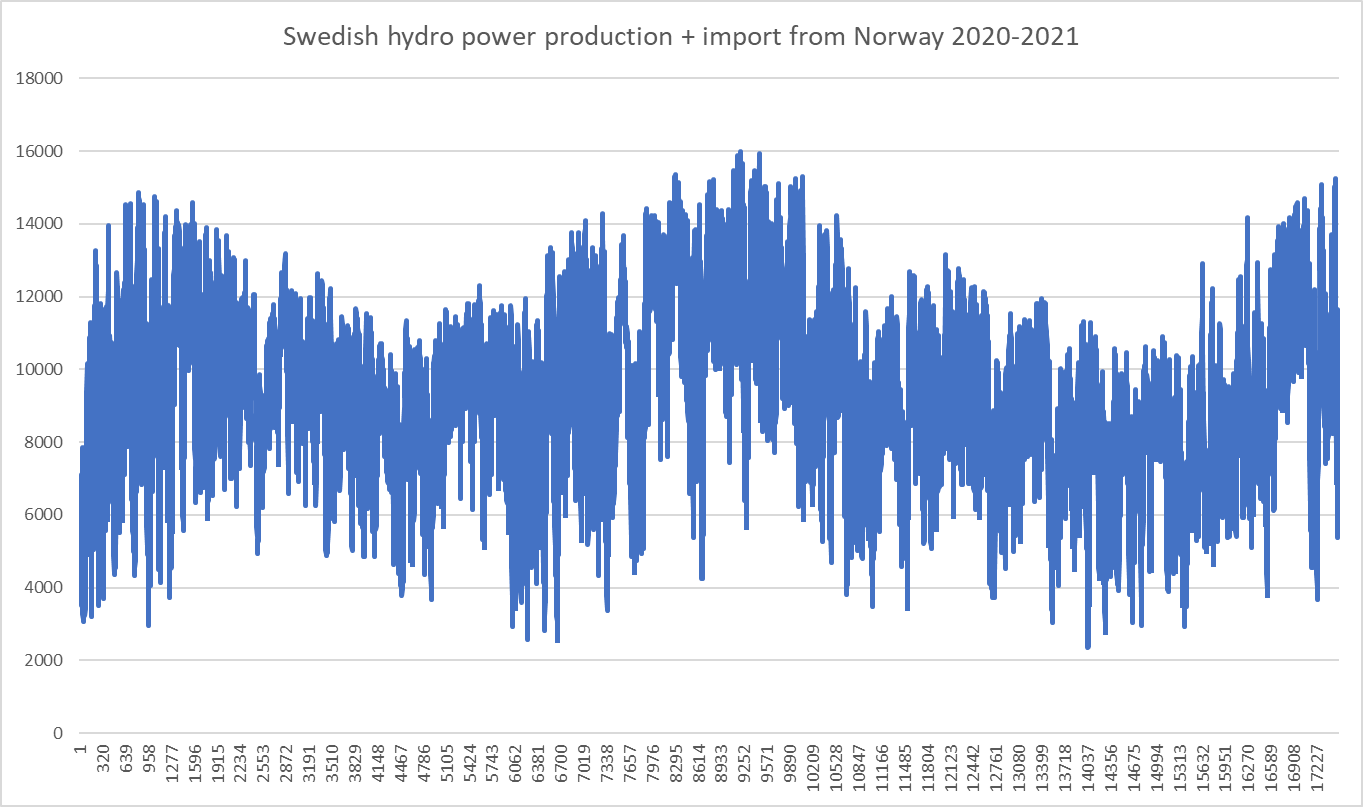
This curve presents the actual Swedish hydro production during 2020-2021, with import from Norway added. Numbers are taken from ENTSO-E. We can recognize notable features of the curves and also the general span. In fact most of the Swedish electricity import came from Norway, about 8 of 10 TWh. If we assume an import limit of 3 GW from Norway and that the Swedish hydro production is between 2 – 13GW we can deploy the following hydro power model:
The supplied hydro power is sourced from Sweden and Norway together as a 2 – 16 GW power source. The average hydro production from Sweden is 67 TWh yearly and the average import from Norway is 7 TWh, so for a typical year the hydro source would be a 2 – 16 GW source with a delivery of 74 TWh yearly. This is a nice, simple and fairly accurate model that also includes the larger part of the Swedish electricity import. Rest of the import will be from other countries that are less reliable from an import point of view due to correlation of weather dependent power sources.
Scenario: No Import/export 2020-2021
As mentioned above the balance includes more import and export than needed to achieve balance between demand and supply. The net export was 25.3 TWh yearly during this period. This is of course nice for Sweden to be able to export green energy abroad, but let’s look at a pure domestic consumption based scenario. The average consumption during 2020-2021 was 137.3 TWh per year. Here is the corresponding balance model for this scenario.
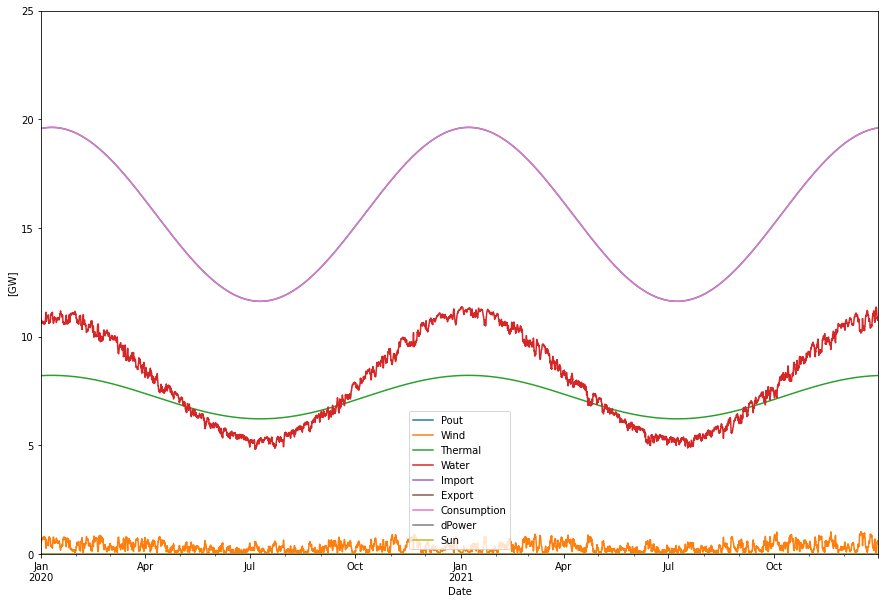
Supplied power per year:      137.29 TWh
Consumption per year:         137.29 TWh
Produced hydro per year:       70.89 TWh
Produced wind per year:         2.97 TWh
Produced sun per year:          0.00 TWh
Produced nuc/bio per year:     63.42 TWh
Here we can see that our actual need 2020-2021 would had been almost entirely covered by the hydro + nuclear/bio power. Only three TWh of wind power is needed for balance, and if we instead had included the “usual” import from Norway no wind power at all had been needed.
So in a way it is clear that the wind power, from this point of view, presently is used entirely for exporting electricity. Of course there will be a need for this power even domestically with the increased electrification in different sectors in Sweden, and it is expected that we will be in balance between domestic demand and supply around 2030.
Conclusion
In this blog post we examined how the Swedish power system in 2020-2021 could be described with a balance model. From a pure supply/demand point of view hardly any wind power was needed for a balanced system. The added wind power is almost entirely used for export.
We also saw that we could, to a high degree, remove the uncertainty between balancing with hydro power or import by considering the Swedish hydro power + 3 GW import of Norwegian hydro power as one and the same power source, now varying between 2 – 16 GW. This was not needed in these scenarios, but becomes handy in the modelling of future power system scenarios.