
Bengt J. Olsson
Twitter: @bengtxyz
An interesting “gedanken” experiment would be to have a scenario where hydro power in Sweden is exchanged with green hydrogen power for balancing the power supply and demand. After all, not many countries are blessed with the natural resources in form off hydro power that we have in Sweden and Norway. In other countries there is a need for a balancing, dispatchable power source that can function as the hydro power does in Sweden.
So let us use the no import/export scenario for Sweden 2020-2021 in the previous post to see what would have been needed in form of hydrogen production, storage and power dispatch in order to replace the hydro power in Sweden.
We will need to supply more wind power than the replaced hydro power, in order to also produce hydrogen out of “surplus” wind power that would otherwise would have been curtailed or exported. This hydrogen is then burned, when deficits occur, in combined cycle hydrogen gas turbines (hydrogen CCGT) to get maximum efficiency.
Here a round trip efficiency for power-H2-power is assumed to be 35%. That is, the losses in first producing the hydrogen with electrolyzers, compressing it for storage, transporting it and finally burn it as fuel in a hydrogen CCGT are expected to be 65%.
Scenario to replace
As a starting point we use the real example from Sweden 2020-2021 where we removed import and export, but otherwise use the actual production and consumption numbers. In 2020-2021 Sweden had good hydro years and produced 70.9 TWh hydro power yearly. It is this power we want to substitute with hydrogen.
Supplied power per year:      137.29 TWh
Consumption per year:         137.29 TWh
Produced hydro per year:       70.89 TWh
Produced wind per year:         2.97 TWh
Produced sun per year:          0.00 TWh
Produced nuc/bio per year:     63.42 TWh
Replacing hydro with hydrogen
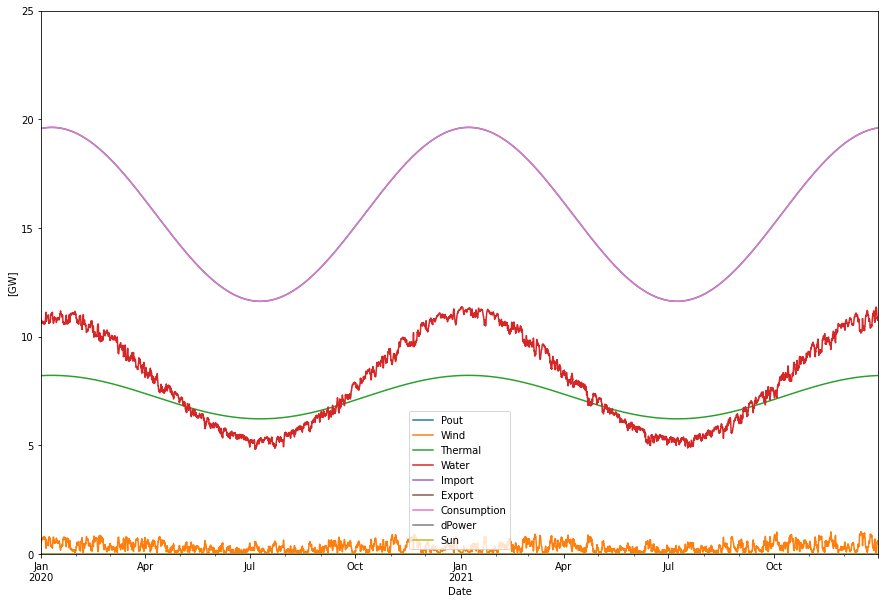
The task is now to iterate the level of wind power needed to get the Swedish power system of 2020-2021, without import or export, in balance. With the extra condition that the opening and closing balances of the hydrogen store should be the same also (otherwise the energy balance also includes the difference in store levels). We also need to decide how much hydrogen electrolyzer and CCGT capacity we need. With more wind power we need less of the latter and vice versa. In this example we have chosen to have the same capacity as in the corresponding hydro scenario, that is 13 GW. So this scenario has 13 GW of electrolyzer capacity and 13 GW of hydrogen CCGT capacity. We then get the following result
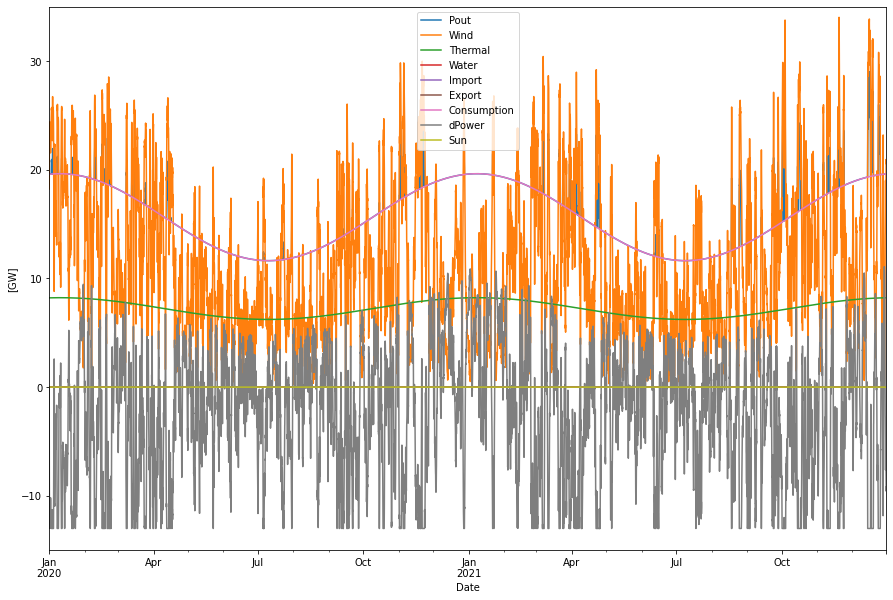
Supplied power per year:      161.69 TWh
Consumption per year:         137.29 TWh
Produced hydro per year:        0.00 TWh
Produced wind per year:        98.27 TWh
Produced sun per year:          0.00 TWh
Produced nuc/bio per year:     63.42 TWh
Curtailed per year              2.15 TWh
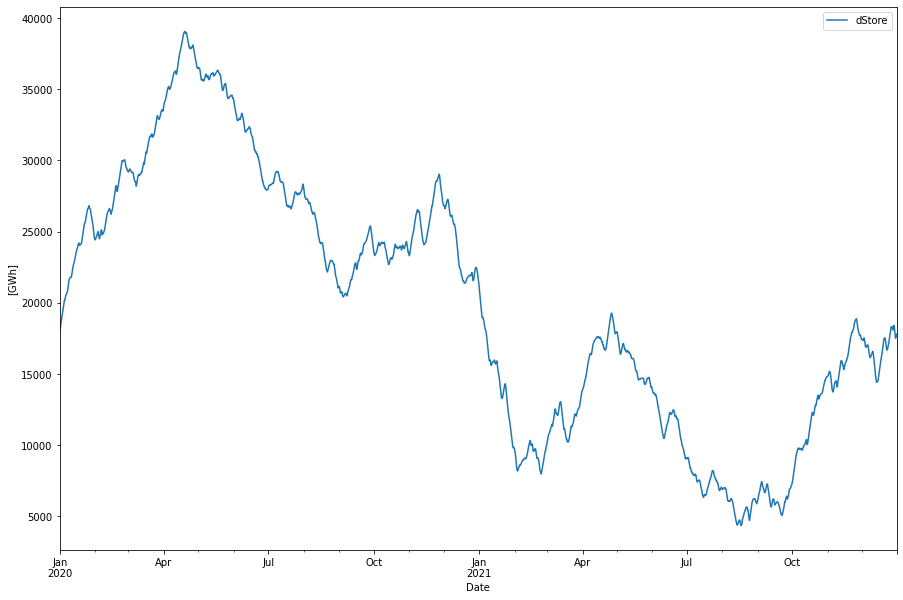
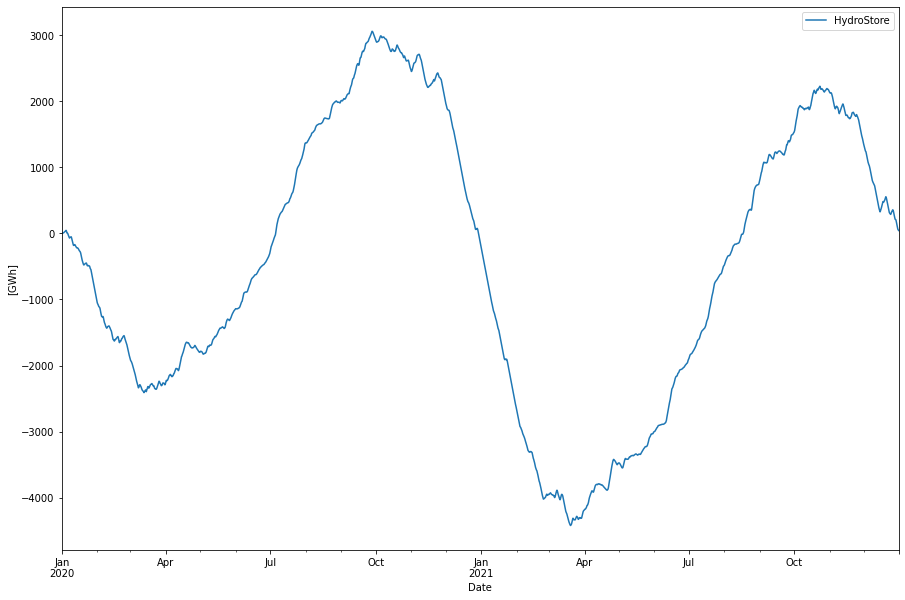
A lot more wind, 98 TWh is needed. Two TWh of this will be curtailed (or exported). The grey curve describes the power dispatch to either produce and store the hydrogen (negative amount) or for producing electricity (positive). Since the production and consumption of this hydrogen is depending on the wind power delivery, a store is needed to hold the hydrogen.
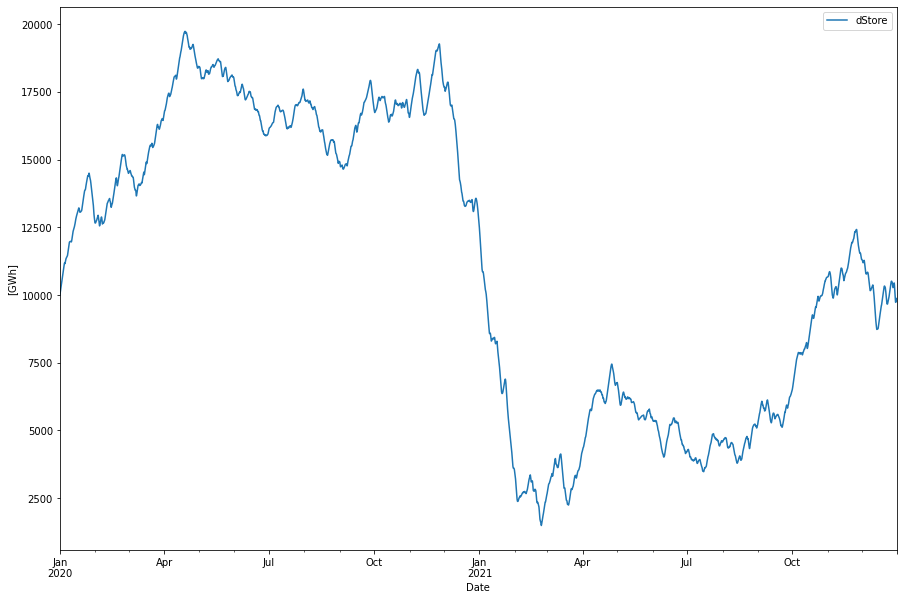
The size of this store is about 20 TWh in this simulation. The store goes from almost full to almost empty during the wind lull of December to January. The size of the store can be compared with the size of the Swedish hydro power reservoirs that are about 30 TWh.
The energy balance thus becomes
Produced power = 98.3 (wind) + 63.4 (nuclear/thermal) = 161.7 TWh
Losses = -2.1 (curtailed) -22.2 (round-trip efficiency loss) = -24.3 TWh
Consumption = - 137.3 TWh
-------------------------
Balance = 0
We can see that the round trip losses are significant and we need to produce 18% more energy in this case.
Also replacing nuclear with hydrogen
If we also wanted to replace the 49 TWh of nuclear energy a lot more wind power is needed and hence more electrolyzer capacity to get the same relatively low level of curtailment as before. We need to increase from 13 to 25 GW of electrolyzer capacity and to 163 TWh wind power to achieve the following power dispatch:
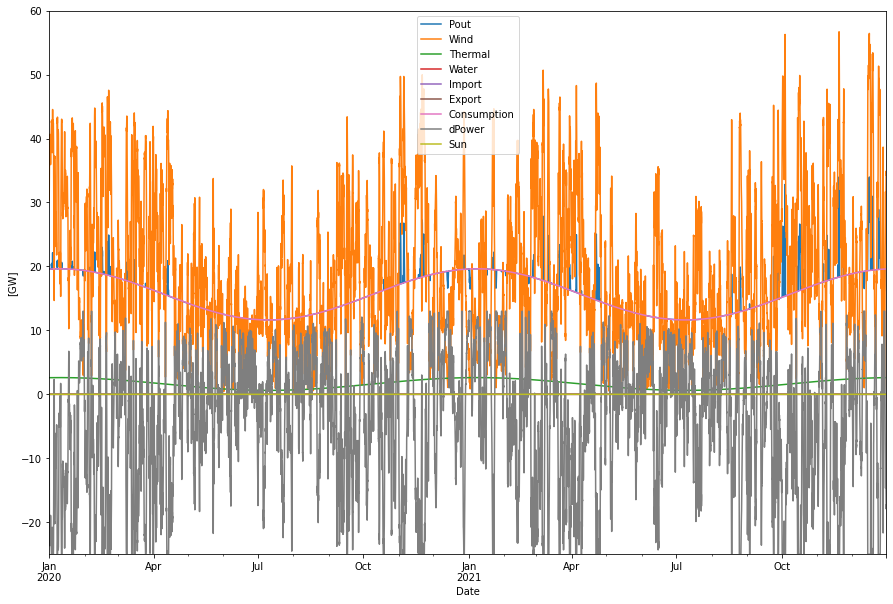
Supplied power per year:      176.98 TWh
Consumption per year:         137.29 TWh
Produced hydro per year:        0.00 TWh
Produced wind per year:       162.77 TWh
Produced nuc/bio per year:     14.21 TWh
Curtailed per year              1.87 TWh
Deficit per year                0.14 TWh
Max shortage:                   3.49 GW
Max overshot:                  17.11 GW
Here we needed to add about 66 TWh more wind power to replace the 49 TWh of nuclear. Almost 38 TWh energy is lost in the conversion steps power-hydrogen-power.
Produced power = 163.8 (wind) + 14.2 (thermal) = 177.0 TWh
Losses = -1.9 (curtailed) -37.9 (round-trip efficiency loss) = -39.8 TWh
Consumption = - 137.3 + 0.1 (deficit) = -137.2 TWh
-------------------------
Balance = 0
Comparing this power dispatch with the first picture we can be grateful to have both hydro and nuclear power in Sweden! But as mentioned, for many countries hydro power is not an option.
The hydrogen store becomes about 35 TWh. Which is a lot.
Importance of RTE factor
An important factor that drives both the overproduction as well as the size of the energy store is the round trip efficiency which is here assumed to be 35%. For an ideal storage this efficiency would be 100%. Let’s test what the difference becomes with 100% efficiency for this last case.
Produced power = 123.0 (wind) + 14.2 (thermal) = 137.2 TWh
Losses = -0.1 (curtail) + 0.2 (deficit) = 0.1 TWh
Consumption = - 137.3 TWh
-------------------------
Balance = 0
As expected we see no conversion loss and hence no overproduction of power (saving some 40 TWh of wind power). The size of the store (for this hypothetical balancing medium) becomes 18 TWh which is about half the size compared to the store for 35% RTE hydrogen.
Needed hydro storage in Sweden
In the first case, when we only replaced the Swedish hydro power (and not the nuclear power) with wind power + hydrogen, we needed “only” a 20 TWh store. Why do we then need 30 TWh of storage in our hydro power system?
This is du to the fact that the Swedish hydro stores are filled very irregularly. The upper part of the graph below shows the flow into the stores and the second graph shows the fill level throughout the year.
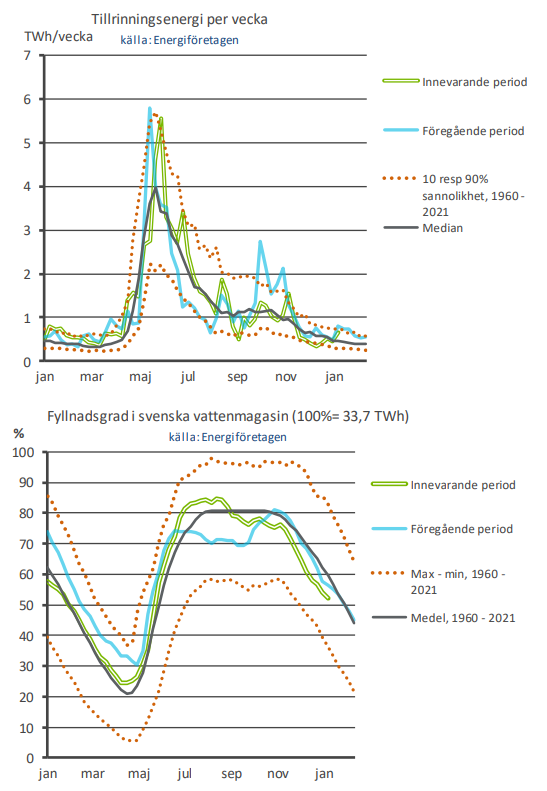
Just to see the actual need of a “perfect” balancing hydro store we can think of store that is filled at a constant rate corresponding to the yearly hydro production divided with number of hours per year. In this case that would be 80.2 TWh / 8772 h = 9.15 GW.
So the actual demand/supply variation was around 8 TWh energy-wise but the actual store variation is around 20 TWh in order to cope also with the uneven inflow.
Conclusion
In this blog post we looked at some hypothetical cases in which the Swedish hydro power 2020-2021 was replaced with a hydrogen balancing solution. Replacing the 13 GW of hydro power would have required 13 GW of electrolyzers, 13 GW of hydrogen CCGT and about 20 TWh of hydrogen storage. And an increase to 98 TWh of wind power.
In a scenario where we also replaced the present nuclear power with wind power + hydrogen we got a system with power dispatch oscillating between +60 GW to -25 GW (vs 20 to 0 GW for the original system) and a hydrogen storage need of 35 TWh. This is more energy than what the Swedish hydro power reservoirs can store.
We can also see that the low round trip efficiency of the power-H2-power cycle both increases the need for installed wind power as well as the needed storage.
Just the thought of building this much hydrogen storage in Sweden is daunting. The largest natural gas store we have now (Skallen) would hold 20-25 GWh of hydrogen based electricity. So we would need around 1000 of these. For countries with better geological conditions that could produce salt caves for storage it would be a little bit easier, but still a huge undertaking.
Also the electrolyzer capacities here are astronomical given that the installed base of these worldwide may be around 1 GW. From an investment cost point of view these should also be utilized as much as possible which is not happening, when only using the wind power peaks that would otherwise be curtailed are used for hydrogen production.
Having a base load power source that offsets a large part of the fluctuating wind power surely helps as seen when comparing the two scenarios, with and without nuclear power.