
Bengt J. Olsson
Twitter: @bengtxyz
The balance model described in this post is used to model the behavior of a future power system for Denmark in 2030. The model is based on production/consumption numbers proposed by “Denmark’s Climate and Energy Outlook 2020” (DCEO) for 2030.
The idea with the simulation is to simplify the model as far as possible but still get some useful information and understanding of the future power balance. Today Denmarks power system is built on three pillars
- Renewable energy (wind and solar)
- Fossil and bio fuel plants
- Trade (import/export)
Denmark doesn’t have much of balance power such as hydro power from water reservoirs. Neither do they have base load power in form of nuclear, but instead have dispatchable power in form of bio/coal/oil/gas plants. Denmark strives to eliminate the fossil fuel sources from their electricity system. Hence we will model a system with only renewable power plus trade, and then look at adding hydrogen storage as flexible (balancing) source.
Modelling the past: 2020-2021
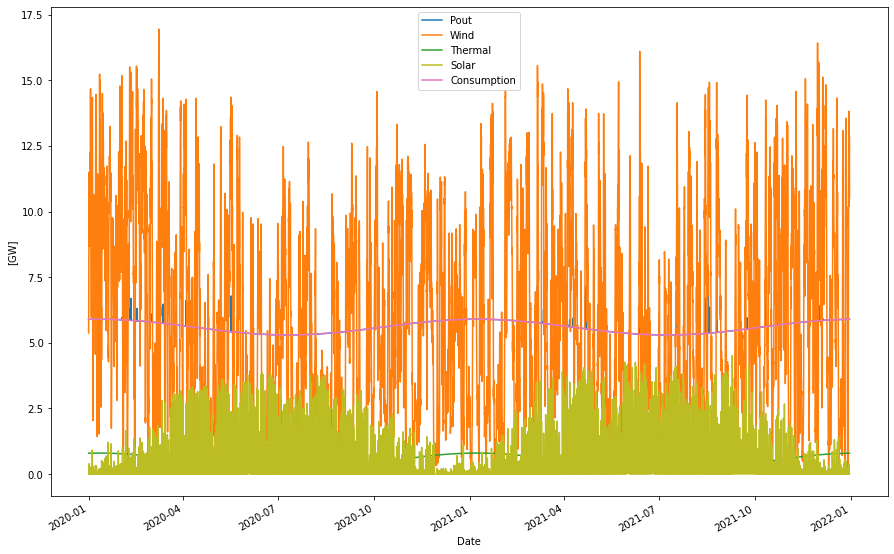
First let us have a look at the status 2020/2021. Hourly production values are taken from ENTSO-E. Onshore and offshore wind power values are added together and presented as “wind” only. All fuel based power sources are also lumped together as one fixed source with a sum around 12.7 TWh per year. Hence all power sources, wind/solar/thermal are considered as must-run sources and should be balanced with the consumption, about 36 TWh per year.
Since we have no balancing hydro power or similar, import and export must do the balancing. In our model it will look like this
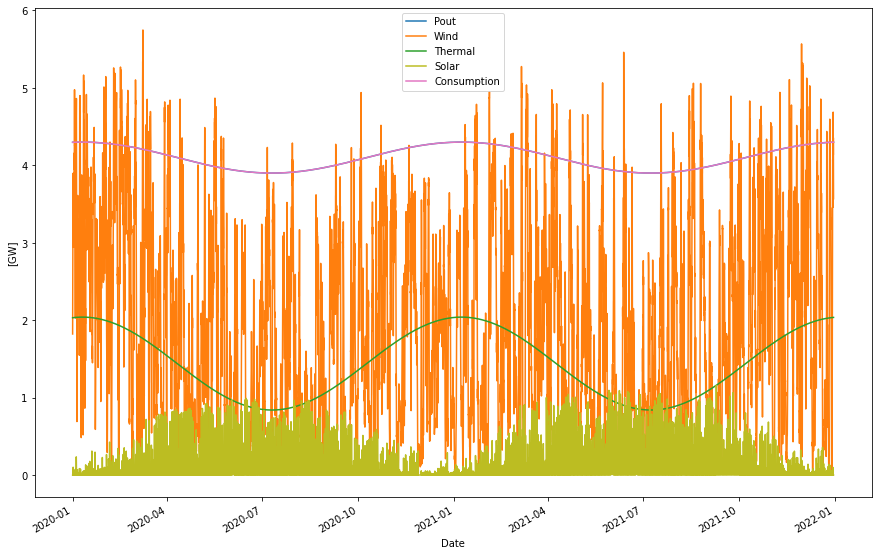
Supplied power per year:       38.80 TWh
Consumption per year:          35.97 TWh
Produced wind per year:        16.25 TWh
Produced solar per year:        1.33 TWh
Produced thermal per year:     12.66 TWh
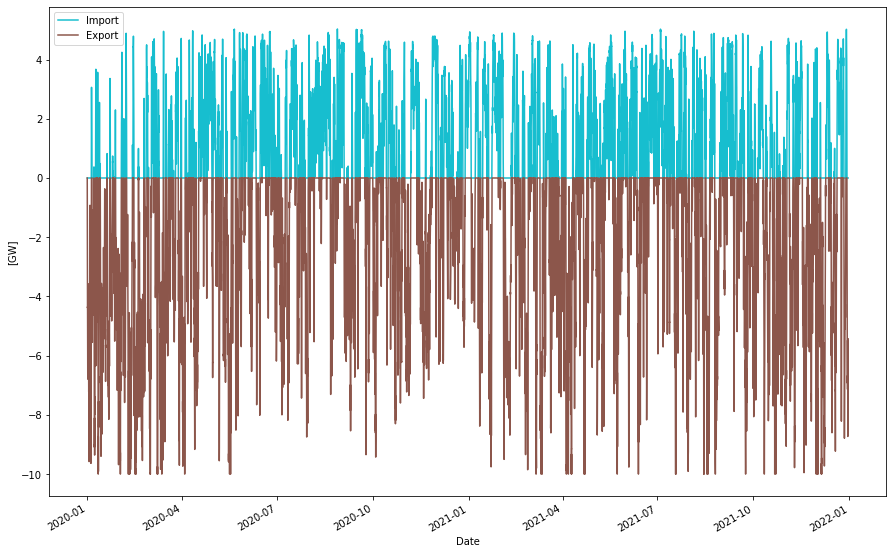
Wind and Solar power curves are ENTSO-E data untouched. The sinus curves for Thermal generated power and Consumption are constructed such that they will provide the yearly reported averages, and a variation that at least reminds on what can be seen the reported data. These curves provides the “must-run” parts of the simulation. Now balancing is needed. Since we don’t have hydro power to balance with only import/export remains. Corresponding graph:
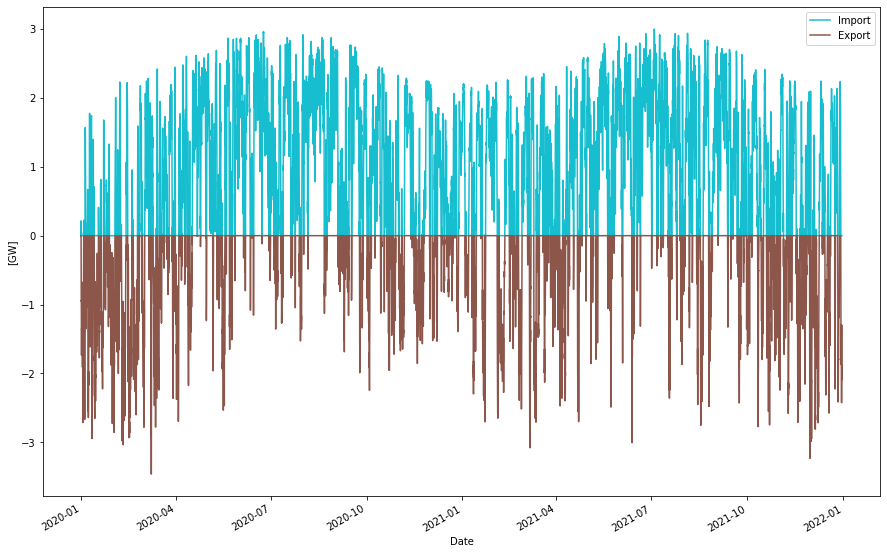
Import per year:                8.57 TWh
Export per year:                2.83 TWh
Net Import per year:            5.74 TWh
We can see that the net import agrees well with the reported (which it of course should in order to balance Consumption and Production).
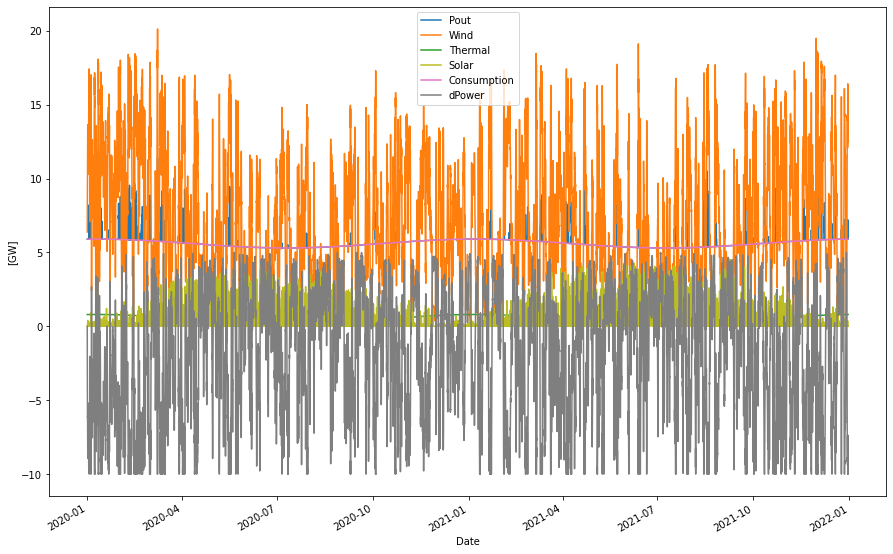
If we compare the import/export from for example July 2021 with measured data we can se that the model quite well captures the import and export events:
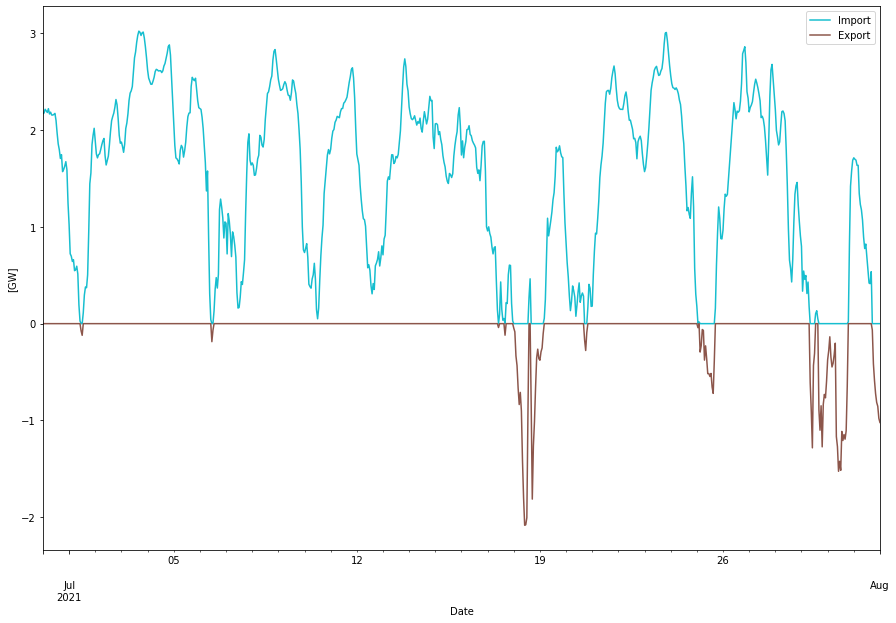
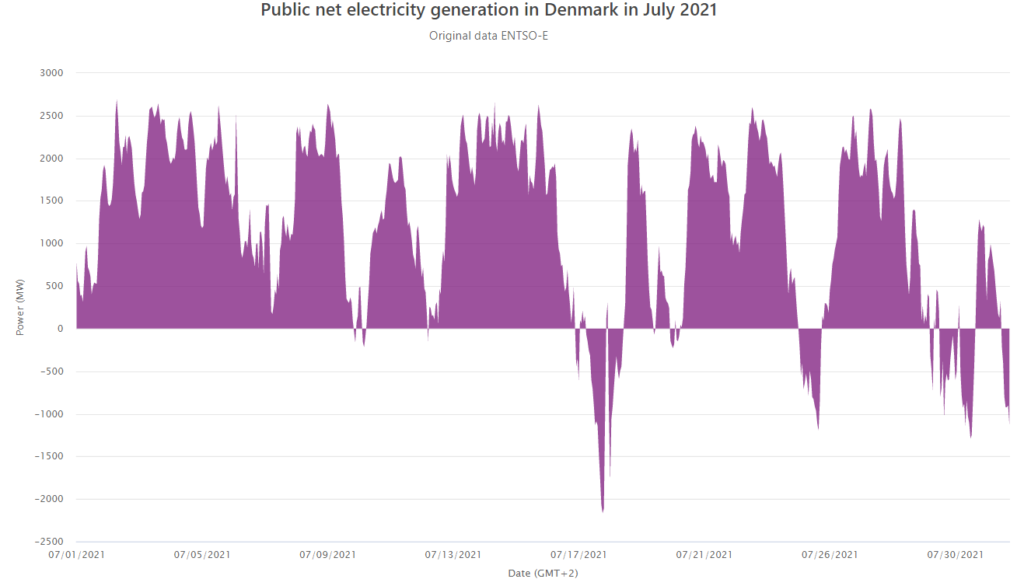
The small differences are because we approximated the thermal production and consumption with smoothed sinus curves. But it seems like the small rapid variations does not affect the general features of the model.
Model for 2030
Now when we have some confidence in the computational model we can look ahead until 2030. For 2030 the DCEO suggests that Denmark has a consumption including transmission losses of about 49 TWh. This consumption has grown “organically” with more datacenters, electrical vehicles and new industrial processes. Hydrogen production is not mentioned in the DCEO 2020. We’ll come back to that later. Since there is no hydrogen production in play it is hard to see that any significant level of flexibility can be reached. In the modelling we don’t assume any flexibility.
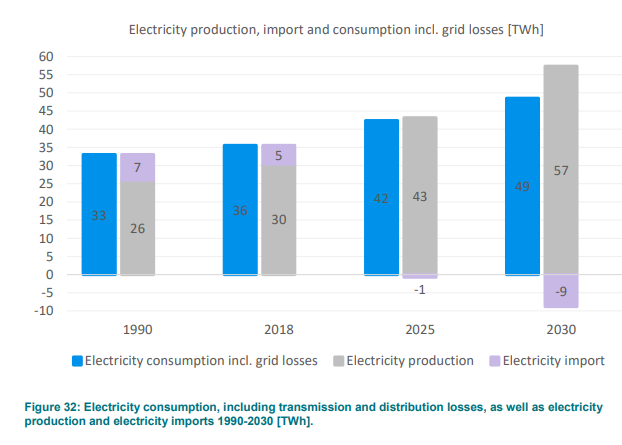
We can see that net import have changed to net export. We assumed about 5 TWh solar, estimated from Figure 7 in the DCEO. We’re also assuming that beside wind and solar power, only the biomass part, that is no coal/oil/gas, of the thermal production is still used for power production and use the average number for biomass for 2020/2021 which was approximately 4 TWh. Then we have 9 TWh of solar and biomass energy and the rest, 48 TWh, to be wind energy.
When the hourly values are scaled to produce the above values we achieve the following power dispatch for 2030
Consumption per year:          49.14 TWh
Produced wind per year:        47.94 TWh
Produced solar per year:        5.18 TWh
Produced biomass per year:      3.96 TWh
Curtailed per year              0.04 TWh
Deficit per year                0.00 TWh
Max shortage:                   0.00 GW
Max overshot:                   3.12 GW
Import per year:               10.00 TWh
Export per year:               17.91 TWh
Net Import per year:           -7.90 TWh
As we can see balance require a high degree of import and export. The disadvantage with this is that, due to correlation of weather systems, import will probably be performed when prices are high and reversely, export will be performed when cheap wind/solar energy is abundant and prices hence are low.
The net export becomes about 8 TWh, which is in good agreement with the 9 TWh suggested by the DCEO above. With an export capacity of 10 GW we get some small curtailment of energy since we get up to 3 GW overshot peaks.
Hydrogen balancing
What if Denmark wanted, for energy security reasons for example, to be self sufficient with respect to power consumption? This could in principle be achieved by producing hydrogen from excess wind power, storing it in salt caverns and use it as fuel in a combined cycle gas turbine in deficit situations, instead of importing. Since we have a net export scenario, there is clearly some excess energy to use for this purpose. This balancing with hydrogen would in principle replace the balancing that in Sweden and Norway is done with hydro power.
The storage requirements will be large but Denmark has the possibility to produce salt caverns, or use aquifers, possibilities that Sweden do not have.
For this simulation, let’s assume that the round trip efficiency for producing H2 from electric power using electrolyzers and subsequently use the gas to produce electricity again, is 35% which is a probable real world estimate when pure hydrogen gas turbines are available. By iterating elecytrolyzer and gas turbine capacities and increasing the wind power production to get a system in balance (also with equal open and closing balance of the hydrogen store since we don’t want to “borrow” or “deposit” energy that would offset the power balances), we get the following power dispatch.
Supplied power per year:       49.72 TWh
Consumption per year:          49.14 TWh
Produced wind per year:        56.87 TWh
Produced solar per year:        5.18 TWh
Produced nuc/bio per year:      3.96 TWh
Cap. util. electrolyzers:      28.36 %
Curtailed per year              0.58 TWh
Deficit per year                0.00 TWh
Max shortage:                   0.01 GW
Max overshot:                   6.12 GW
Import per year:                0.00 TWh
Export per year:                0.00 TWh
Net Import per year:            0.00 TWh
We achieve balance with 10 GW of electrolyzer and 5 GW of hydrogen CCGT capacity, after adding about 9 TWh more of wind energy. As can be seen, this is then a self-sufficient system with no import or export.
Due to seasonal (and as we’ll see, yearly) variations in the wind (and sun) the hydrogen must be stored. In this case, with the wind and solar statistics of 2020/2021 the store would have the following fill levels
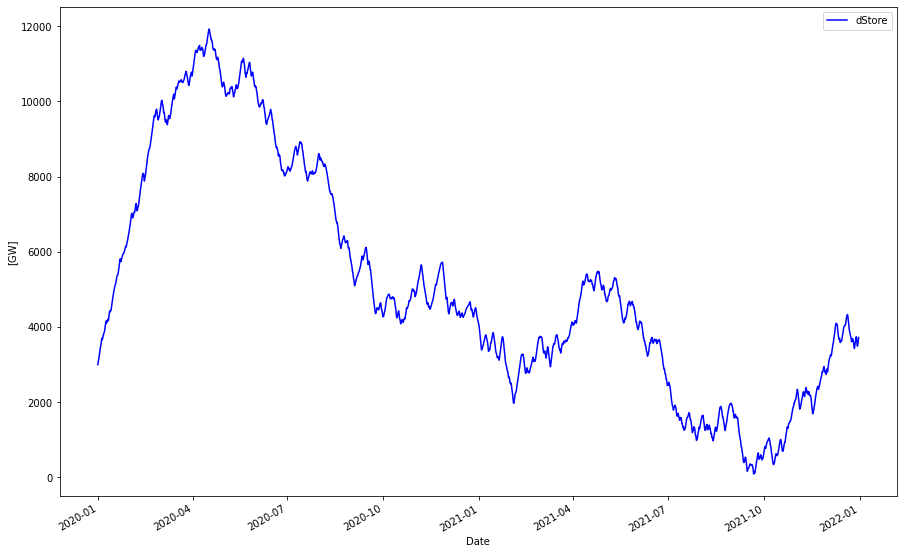
As seen a 12 TWh hydrogen store would be required in this case. We also see that the cycle is not seasonal but over two years here. The lower winds of 2021 necessitates a larger store than needed for just covering the seasonal variations of 2020, were approximately 10 TWh would have been sufficient. It is hence important to consider multi-year variations in weather dependent power sources when dimensioning the store.
Note that the 12 TWh is measured in “power in” units, i.e. power consumed for producing the hydrogen. The extra costs incurred for energy security in this case is hence the cost for
- 10 GW electrolyzer capacity
- 5 GW hydrogen CCGT capacity
- 9 TWh extra wind production
- 12 TWh hydrogen storage
This should be added, together with appropriate cost of capital additions to the original 57 TWh of power production without storage to get an estimation of the real LCOE of the wind/solar power. This would be the subject of another blog…
Looking at Denmarks gas storage facilities they seem to store approximately 10 TWh of natural gas energy. If this pertains to the calorimetric energy content it should be compared to the same for our H2 store which would be about 7 TWh. But natural gas can hold about 4 times more energy than H2 at the same volume and pressure. So coarsely this would mean that about three times todays gas storage volumes would be needed to store the hydrogen gas in this case. Is this feasible? (Would be nice also if someone could double-check all these conversion numbers between natural gas and hydrogen storage…). Note that the present storage would still be needed for non-power usage of gas, such as for heating and industrial processes.
By increasing the electrolyzer capacity, wind power capacity as well as the storage volumes, excess hydrogen could be produced also for use in other sectors such agriculture, industry and transport.
Conclusions
A future scenario for Denmark 2030, in accordance with the “Denmark’s Climate and Energy Outlook 2020“, was modelled. Assumed consumption 2030 was 49 TWh. An energy mix of 7% biomass, 9% solar and 84% wind energy together produced 57 TWh of energy. This gives a net export of the difference 8 TWh, provided also by the difference between 10 TWh import and 18 TWh export to keep the balance. Unfortunately for Denmark, import is likely done when prices are high, and reversely, export is done when prices are low.
A simulation with a hydrogen energy store sufficiently large to make Denmark independent of import presented the following additions to the 2030 network:
– 10 GW electrolyzer capacity
– 5 GW hydrogen CCGT capacity
– 9 TWh extra wind production (57 TWh in total)
– 12 TWh hydrogen storage
The 12 TWh hydrogen storage would require about 3 times the present gas storage capacity in Denmark.