Bengt J. Olsson
Twitter: @bengtxyz
LinkedIn: beos
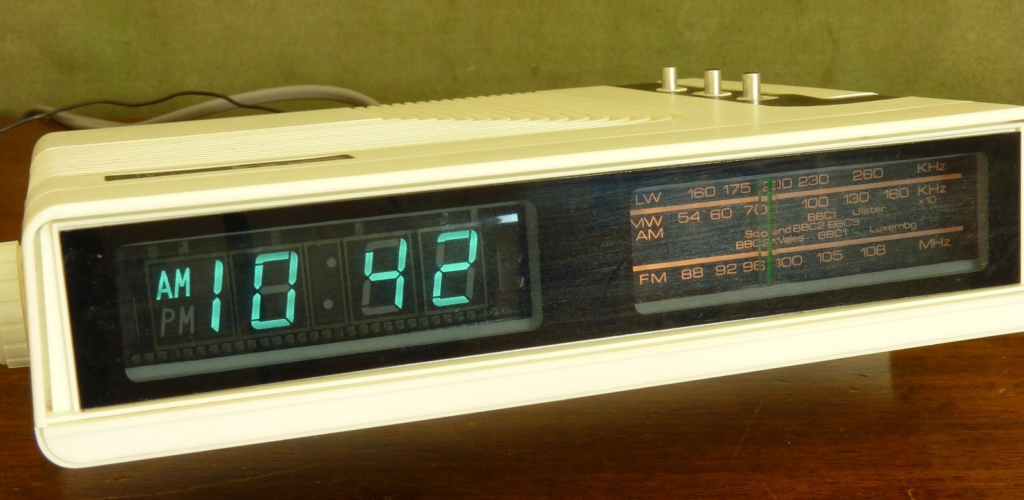
A recent post on LinkedIn from Svenska Kraftnät (SvK, the Swedish TSO) states that the power system “used to” control clock time. Those of us who are a bit older remember our bedside clock radios – remarkably precise, with no obvious reason why. You never had to set them; they just kept perfect time. This, of course, was because the clocks were synchronized to the AC power frequency (50 Hz in Europe), and the power system itself was kept in sync with UTC – frequency-wise.


Nowadays, clocks are typically controlled via internet protocols like NTP, which easily maintain sub-second accuracy relative to UTC. But can we still control clocks via the power system? According to the network codes (regulations for European power system operators), there is indeed a requirement to regulate the time difference between a network-synchronized clock and UTC.

The regulation itself does not specify hard limits, but ENTSO-E does so in its Nordic System Operation Agreement (SOA):
“Synchronous area monitor shall endeavour to maintain the electrical time deviation within a time range of ±30 seconds. If the time deviation has reached ±15 seconds, operators of Synchronous area monitor shall make a plan to reduce the time deviation.”
So there we have it. TSOs are expected to maintain (or at least aim to maintain) a clock within ±30 seconds of UTC. The caveat is that adjusting the network frequency to correct network time can interfere with keeping sufficient reliability margins to handle typical frequency disturbances. In other words: frequency control takes precedence over time correction.
Time Error Analysis
So how does the Nordic power system perform, from a timekeeping point of view?
To investigate this, I downloaded frequency data from Fingrid. The dataset consists of frequency samples covering all of 2024. Since the sampling interval is 0.1 seconds, the full dataset contains over 300 million data points – a bit too much for my desktop PC to process comfortably.
To make things manageable without losing much fidelity, I downsampled the data to 1-second resolution. There were some missing or duplicate samples that were handled by interpolation. There were also longer gaps (e.g., two hours in December), which I filled in using the nominal frequency of 50 Hz. This “repair” of the dataset has very little influence on the final results.
Below is a plot of the raw frequency samples (averaged over 1 second):

Next, here’s the integrated time error (TE), calculated by accumulating the frequency deviations over time. The baseline used is the average frequency (50.00023380 Hz) of the sample; using 50.000 Hz as baseline instead would produce a ramping error of 140 seconds across the year. The difference in baselines may stem from adjustments made to fill missing data.
Here’s the resulting graph:

From the graph above, we can conclude two things:
- The Nordic TSOs maintain a long-term average frequency that is well locked to the UTC reference.
- However, you probably don’t want to synchronize your clock to the network frequency anymore – ±20 seconds is not acceptable by today’s standards.
Frequency Analysis
While we’re at it, let’s look at the spectral properties of the frequency signal. By applying a Fast Fourier Transform (FFT) to the time series data, we can spot some recurring patterns:

Frekvens: 2.6620e-04 Hz  | Period:  3756.52 s | Period:  1.04 h |Amplitud: 0.0060 | 1
Frekvens: 2.5463e-04 Hz  | Period:  3927.27 s | Period:  1.09 h |Amplitud: 0.0044 | 2
Frekvens: 2.8935e-04 Hz  | Period:  3456.00 s | Period:  0.96 h |Amplitud: 0.0040 | 3
Frekvens: 1.6667e-02 Hz  | Period:    60.00 s | Period:  0.02 h |Amplitud: 0.0040 | 4
Frekvens: 2.3148e-05 Hz  | Period: 43200.00 s | Period: 12.00 h |Amplitud: 0.0037 | 5
Frekvens: 3.0093e-04 Hz  | Period:  3323.08 s | Period:  0.92 h |Amplitud: 0.0034 | 6
Frekvens: 1.1574e-05 Hz  | Period: 86400.00 s | Period: 24.00 h |Amplitud: 0.0032 | 7
Frekvens: 1.1343e-03 Hz  | Period:   881.63 s | Period:  0.24 h |Amplitud: 0.0029 | 8
Frekvens: 2.7778e-04 Hz  | Period:  3600.00 s | Period:  1.00 h |Amplitud: 0.0029 | 9
The most prominent features are peaks 1, 2, 3, 6, and 9 – all close to one-hour periods. These correspond to hourly market operations: at the start of each hour, net positions are updated based on market outcomes. Generators and loads adjust their output accordingly, often causing step changes in frequency.
Other spikes appear at 24 hours, 12 hours, 15 minutes, and 1 minute. The 15 min spike could probably be attributed to activation of balancing services such as FRR which are activated in 15 minutes intervals as I understand it. But the others are harder to explain – perhaps someone has insight into their origins?
