
Bengt J. Olsson
LinkedIn: beos
X/Twitter: @bengtxyz
AI summary
- The setup. At a 4 % WACC (75 % state-backed debt at 1 % real, 25 % equity at 13 %), almost no new nuclear is built without support, and offshore wind only up to 4.9 GW. From this baseline, either 5 GW of new nuclear or 8.9 GW of new offshore wind is forced into the 2040 Nordic system. Both give about 35 TWh per year.
- Same effect on prices. Both lower the Nordic load-weighted price by about 5 €/MWh, increase net exports by 19–20 TWh and cut consumers’ electricity bill by about 3 billion € per year. Both push out about 10 GW of solar, mostly in Denmark.
- Similar strike prices. The CfD strike price needed to break even is 81 €/MWh for nuclear and 79 €/MWh for offshore wind: the plant’s capture price plus the premium the model finds is needed.
- Higher top-up for offshore wind. Offshore wind sells most of its power when it is windy and prices are low (capture price 64 against 74 €/MWh for nuclear), so the direct CfD top-up is 15.2 €/MWh against 6.4 for nuclear. This assumes nuclear is paid off over its 60-year life. With a 40-year support period the nuclear strike price rises by about 8 €/MWh, which brings its top-up to about the same level as offshore wind’s (see the Appendix).
- Higher loan support for nuclear. The loan guarantee is worth 29.9 €/MWh to nuclear and 13.5 to offshore wind, since nuclear needs more capital per MWh. It is not a payout: the state borrows and lends at 1 %, and its cost is the risk it takes on. In total, state support is 36 €/MWh for nuclear and 29 for offshore wind.
- System cost favours nuclear. The total system cost rises 4.2 €/MWh per forced MWh with nuclear and 9.5 with offshore wind (+149 against +329 million € per year). Nuclear also replaces 4.8 GVA of synchronous condensers and some onshore wind, because its generators provide grid strength.
- Welfare. Lower prices move money from producers to consumers, and the state pays part of the bill. What remains is the change in system cost: total welfare falls by 149 million € per year with nuclear and 329 with offshore wind.
- Placement in southern Sweden. If the same capacity is forced into SE-S, the surplus is trapped behind limited cable capacity. The SE-S price falls by about 15 €/MWh instead of 3–5, and consumers gain 5.2–5.5 instead of 3 billion € per year. The new plants’ capture price then falls (nuclear 61.6 €/MWh), so the CfD top-up and the system cost rise several times over: +583 (nuclear) and +648 (offshore wind) million € per year. Sweden carries the whole net cost, while its neighbours break even or gain.
- The caveats. 4.2 of the 5 GW of nuclear is built in Denmark, where nuclear power is banned today. The risk the state takes on through the loan guarantees has a societal cost, larger for nuclear, that is not included. Transmission grid costs are not part of the model.
- Conclusion. The two alternatives are roughly on par in this model. Where the capacity is placed matters more than which technology is chosen. Future cost developments, grid costs, permitting and how well each fits new demand must be weighed alongside the CfD cost analysis.
In the previous post, some scenarios for loan subsidies to support nuclear and offshore wind power were explored. Depending on the assumed discount rate and investment costs, different amounts of the two were built. The central scenario was Scenario 3, with a 3 % discount rate and nuclear and offshore wind costs from Svk’s Långsiktig marknadsanalys 2026 increased by 25 % (and ten years’ construction time for nuclear). In that scenario about 9.5 GW of new nuclear and 3.6 GW of new offshore wind were built.
Here we look at the same problem from a CfD and total-cost viewpoint, at a 4 % discount rate, where almost no new nuclear is built without support, and offshore wind only up to 4.9 GW. Nuclear and offshore wind power costs are the same as Scenario 3 in the previous post (SvK LMA26 2040, increased 25% and assuming 10 years nuclear build time). The Nordic is treated as one country with six zones.
CfD cost components
The questions to answer then become:
- What is the strike price of a CfD that enables the build-out of the particular power production, given the used WACC?
- What is the premium the state needs to “top-up” to reach the CfD strike price level?
- What is the value of the loan guarantees in the two cases?
- What is the added system cost for the two cases?
The first two questions answer how much each project, nuclear or offshore wind, needs to receive in €/MWh for its produced energy in order to finance the project and get a return of equity to the desired level. The strike price is the price per MWh the forced capacity needs to break even at a 4 % WACC: the average market price (capture price) plus the support per MWh the model finds is needed (the premium).
The answer to the third question tells us how much interest saving the project receives yearly due to lower rate of the loans provided by the state. This is a “soft subsidy” since the state does not necessarily lose money, unless the projects fail. But the loan guarantees have an alternate cost in that they could have been used for other purposes.
The last question, about the total system cost, relates to efficiency of the complete system, and is a measure of the total welfare change in the system (consumer value – producer cost).
This is the kind of total system cost analysis that needs to be done when comparing different build-out scenarios, when only component LCOE does not give the whole picture.
In this case we will start from the point where the last blog left, in a comment that suggested that 3% discount rate was too low.
About the discount rate (WACC)
Assume the discount rate (WACC) is formulated like this: The owners finance the whole project, 75 % with debt and 25 % with their own equity. The state guarantees the debt, so it is raised at the government’s borrowing rate: 1 % real (3 % nominal − 2 % inflation). The equity carries the project risk and requires a higher return.
| Debt (state-guaranteed) | Equity | Real, pre-tax WACC | |
|---|---|---|---|
| Share of capital | 75% | 25% | |
| Previous post | 1% | 9% | 3% |
| This post | 1% | 13% | 4% |
The 3% WACC used in the previous post produced about 9.5 GW new nuclear and 3.6 GW new offshore wind. 9% return on equity may be enough for a state-guaranteed project, but in this post we will use a 4% WACC, corresponding to a high 13% (pre-tax) return on equity. The reason is both to have an even more conservative assumption on the WACC, and also that at this WACC, almost no new nuclear, and only 4.9 GW of offshore wind, is built endogenously, and we hence have to force in and subsidize these.
The new baseline thus “locks in” 0 GW new nuclear and 4.9 GW of new offshore wind power and optimizes the system around this (at the standard 6% discount rate for everything else), and provides a baseline total system cost. That is, in this 2040 baseline scenario there already exists 4.9 GW of new offshore wind power. This is important, since this “semi-new” offshore wind power 2040 will not receive the CfD support, because it is already included in the baseline.
From this baseline we do two variations:
- Force in 5 GW of new nuclear in the Nordic system, or instead
- Force in 8.9 GW of new offshore wind power (on top of the new 4.9 GW from the baseline)
Both will provide approximately 35 TWh per year in new energy, based on their capacity factors. But the total system costs will be different, as will the CfD subsidy amounts.
Results
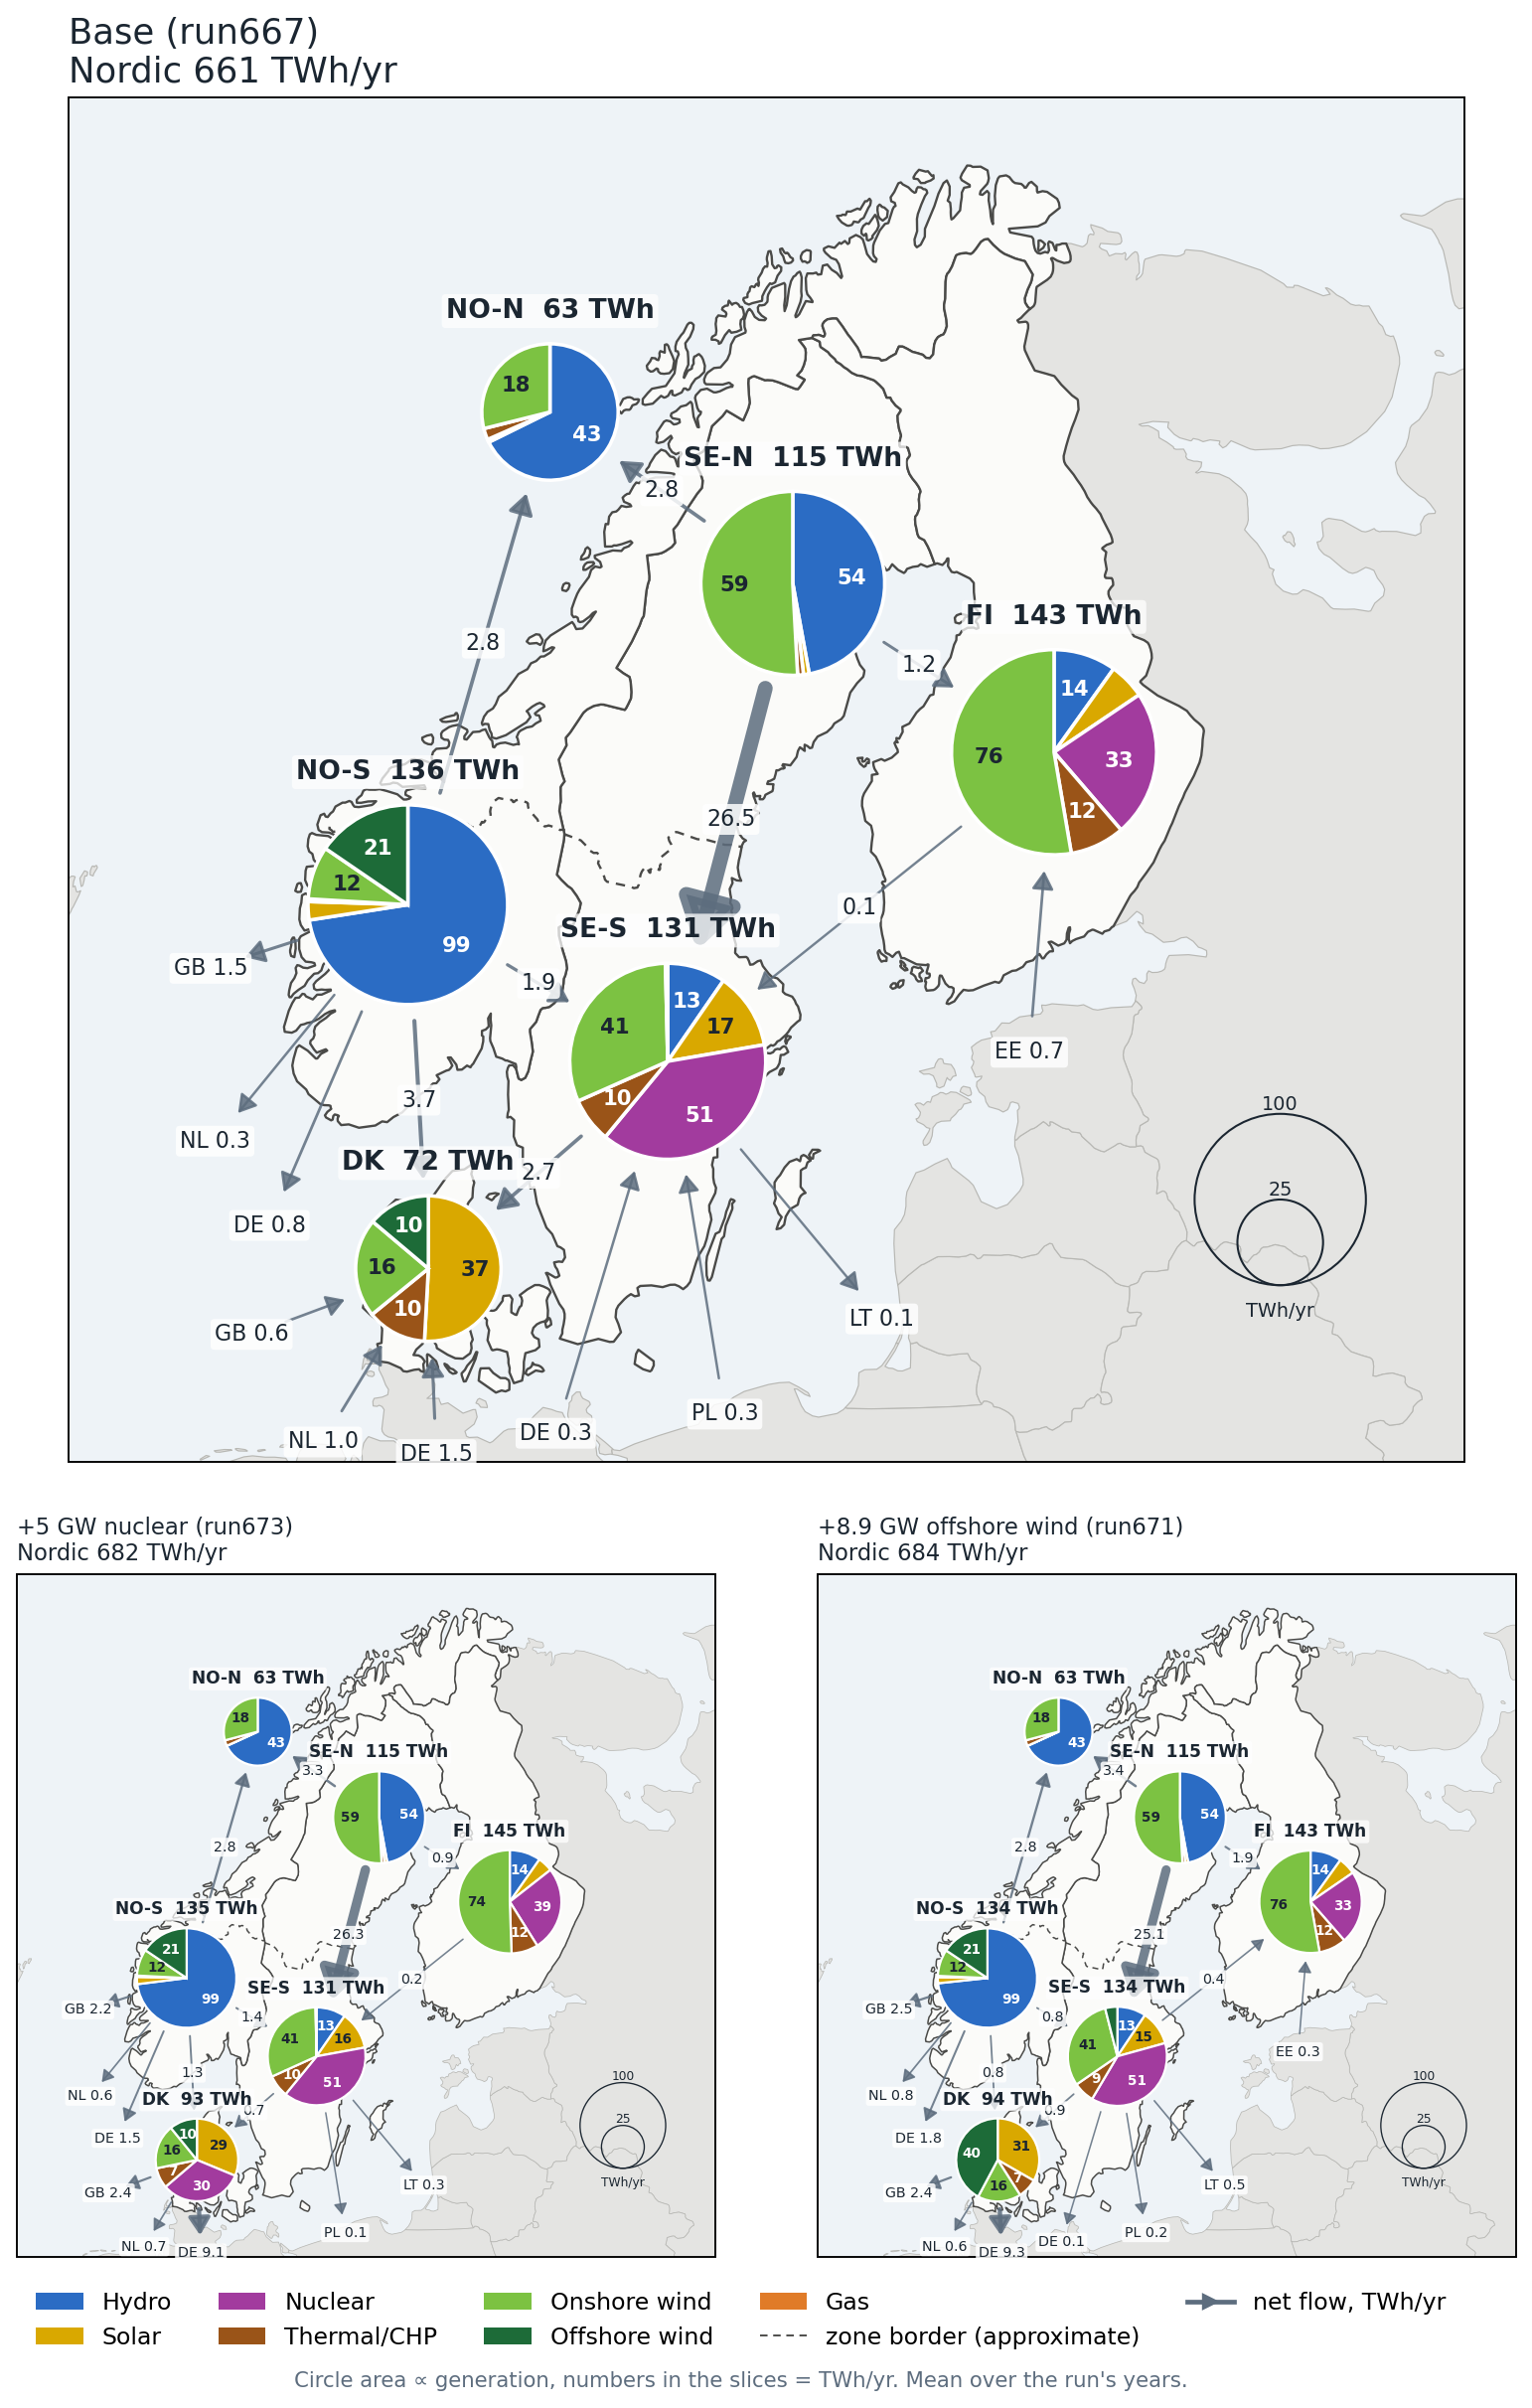
The two forced power scenarios yielded the following results:
| Against the base (run667) | +5 GW nuclear (run673) | +8.9 GW offshore wind (run671) |
|---|---|---|
| Forced new energy (TWh/yr) | +35.8 | +34.5 |
| Electricity price, Nordic, load-weighted (€/MWh) | −4.9 | −4.9 |
| Electricity price SE / NO / DK / FI (€/MWh) | −3.2 / −2.9 / −8.7 / −7.7 | −5.0 / −4.2 / −9.2 / −2.5 |
| Consumers’ electricity bill (M€/yr) | −3,061 | −3,039 |
| Net export to the continent (TWh/yr) | +18.7 | +19.8 |
| Solar output (TWh/yr) | −10.6 | −8.9 |
| Curtailment (TWh/yr) | −1.7 | −0.9 |
| System cost (M€/yr) | +149 | +329 |
| CfD settlement, new capacity (M€/yr, mean) | +230 | +525 |
| Loan guarantee, new capacity (M€/yr) | +1,070 | +467 |
| Total state support (M€/yr) | +1,300 | +992 |
| Market revenue, existing offshore wind (M€/yr) | −174 | −252 |
| Per forced MWh (€/MWh) | Nuclear | Offshore wind |
|---|---|---|
| CfD strike price (volume-weighted) | 80.8 | 79.0 |
| Capture price, 1-hour dispatch (volume-weighted) | 74.4 | 63.8 |
| State support | +36.3 | +28.7 |
| of which CfD settlement | +6.4 | +15.2 |
| of which loan guarantee | +29.9 | +13.5 |
| System cost | +4.2 | +9.5 |
| Market revenue, existing offshore wind | −4.9 | −7.3 |
The results are quite interesting. Both alternatives provide about the same additional energy, about 35 TWh per year, and lower the average price by 5 €/MWh. Both increase net exports by 19-20 TWh. The customer collective thus earns the same, about 3 billion €/year. So it seems like there is no difference between the two alternatives. Well, let’s look at the costs, it will provide a mixed picture.
The CfD strike price becomes 81 and 79 €/MWh for nuclear and offshore wind, respectively (which is surprisingly close to what the Swedish delegation on new nuclear proposed). However, with a lower capture price for offshore wind, a higher direct subsidy, 15 €/MWh, is needed to cover for the price difference than for nuclear that only needs 6.4 €/MWh in direct support.
On the other hand, the loan guarantee subsidy is higher for nuclear, at 30 vs 14 €/MWh. Note however, that this is a “soft” subsidy, since the loan guarantee costs the state nothing as long as the project succeeds, but it is worth about 1 billion € per year to the owners: that is how much more the nuclear plants would cost to finance at 6 % instead of 4 %.
Looking at the total system cost, we see that it increases twice as much per added offshore wind MWh as per nuclear MWh. Thus the system provides the energy more efficiently with nuclear. Nuclear also replaces 4.8 GVA of synchronous condensers and some onshore wind, because its generators provide grid strength; offshore wind does not. The break-down is seen in this table:
| Against the base | +5 GW nuclear | +8.9 GW offshore wind |
|---|---|---|
| Capacity (GW) | ||
| Nuclear | +5.0 | 0 |
| Offshore wind | 0 | +8.9 |
| Onshore wind | −0.9 | 0 |
| Solar | −10.3 | −9.4 |
| Synchronous condensers (GVA) | −4.8 | +0.3 |
| CHP, district heating | −2.5 | −2.4 |
| Heat pumps and electric boilers | +0.7 | +0.5 |
| Cost (M€/yr) | ||
| Capital cost | +1,733 | +2,128 |
| Operation and trade | −1,584 | −1,799 |
| System cost | +149 | +329 |
| Per forced MWh | ||
| Forced new energy (TWh/yr) | 35.8 | 34.5 |
| System cost per forced MWh (€/MWh) | +4.2 | +9.5 |
Note! The top-up is expressed per year over each technology’s economic life (60 years for nuclear, 25 for offshore wind, which is then rebuilt). See the Appendix for a recalculation of the 5 GW nuclear in SE-S case from 60 to 40 years support period.
Summary
In total, the difference can be broken down in welfare terms. Consumers win big on both CfD solutions. Producers lose this income but are partly compensated by the state through the subsidies (and by increased export). Consumers’ gain, minus the state’s support, minus the producers’ loss, equals the change in total welfare (which is negative here since the new power is forced into the system).
In total the nuclear alternative is less costly in welfare terms, than the offshore wind alternative. However, the difference is small, and could be altered, in both directions, by other assumptions.
| M€/yr | +5 GW nuclear | +8.9 GW offshore wind |
|---|---|---|
| Consumers (lower electricity bill) | +3,061 | +3,039 |
| State, CfD settlement | −230 | −525 |
| State, loan guarantee | −1,070 | −467 |
| Producers (remainder) | −1,910 | −2,376 |
| Total welfare (= −Δ system cost) | −149 | −329 |
It is interesting that in the public discourse, the high direct subsidy for nuclear, the “top-up” pay-out to get to the CfD strike price is often used as an argument against the nuclear proposition. But from the above we see that this component is more than twice as high for the offshore wind alternative.
The other publicly discussed “cost”, the loan guarantee subsidy, is twice as high for nuclear. But this is not a pay-out from the state to the producers. It is the value for the producers due to the state taking over a large part of the risk. The state earns no money on the loans: it borrows at 1 % and lends at 1 %. The cost to the state is the risk it takes on, not a cash outflow. However, that risk is associated with a societal cost that should be added to both alternatives, and more so to nuclear.
All-in-all the two alternatives are rather on par in this model. Future cost developments, transmission network costs, right issues, system stability performance, fit for demand (for example EV charging and AI data centers have different demand profiles) must all be considered in addition to the CfD cost analysis.
Addendum: Forcing new production to southern Sweden,
welfare distribution
With a free expansion, but with 5GW new nuclear, or 8.9 GW new offshore wind required anywhere, most of it is built in Denmark, since Denmark has high capacity interconnects with the continent and Great Britain. From a total system cost of view, this becomes the most optimal solution for Nordics as whole.
However, nuclear is banned in Denmark. So let’s do the experiment like this instead. We do the same free expansion, but now we limit the same nuclear or offshore wind power build-out to only occur in the southern part of Sweden (zone SE-S in the model). This changes the outcome quite a bit.
Below are all results saved in a table:
| Base | Nuclear 5 GW free | Nuclear 5 GW SE-S | Offshore 8.9 GW free | Offshore 8.9 GW SE-S | |
|---|---|---|---|---|---|
| Forced energy, TWh/yr | – | 35.8 | 35.8 | 34.5 | 34.3 |
| Prices, €/MWh | |||||
| Mean price SE-S | 74.2 | 71.0 | 59.1 | 69.2 | 61.1 |
| Price Sweden (load-weighted) | 73.6 | 70.4 | 58.9 | 68.7 | 60.8 |
| Price Nordics (load-weighted) | 76.3 | 71.4 | 67.7 | 71.4 | 68.6 |
| Price DK / FI | 79.6 / 80.8 | 70.8 / 73.2 | 76.6 / 77.1 | 70.3 / 78.3 | 77.0 / 77.4 |
| Capture price, new capacity | – | 74.4 | 61.6 | 64.6 | 54.4 |
| Strike price (4 %) | – | 80.8 | 81.3 | 79.1 | 80.6 |
| Costs, M€/yr (Δ against base) | |||||
| System cost | 22,429 | +149 | +583 | +329 | +648 |
| Consumers (gain) | – | +2,907 | +5,238 | +2,922 | +4,763 |
| CfD top-up | – | 300 | 819 | 829 | 1,010 |
| Loan guarantee | – | 1,070 | 1,070 | 467 | 467 |
| Total support | – | 1,370 | 1,889 | 1,295 | 1,476 |
| Per forced MWh, €/MWh | |||||
| System cost | – | 4.2 | 16.3 | 9.5 | 18.9 |
| CfD top-up | – | 8.4 | 22.9 | 24.0 | 29.5 |
| Loan guarantee | – | 29.9 | 29.9 | 13.5 | 13.6 |
| Total support | – | 38.3 | 52.7 | 37.5 | 43.1 |
| Energy, TWh/yr (Δ against base) | |||||
| Export to the continent | −1.9 | +18.7 | +13.3 | +19.8 | +11.4 |
| Solar | 67.0 | −10.6 | −11.4 | −8.9 | −11.5 |
| Onshore wind | 221.0 | −1.7 | −3.8 | +0.1 | −4.8 |
| Curtailment | 5.1 | −1.7 | −1.5 | −0.9 | ±0 |
The main differences from the changed dynamics are:
- With only about 1.9 GW of direct cable capacity to the continent, SE-S traps the surplus: its mean price falls by 13–15 €/MWh, against 3–5 when the capacity is placed freely, and exports rise by 11–13 TWh/yr instead of 19–20.
- Capture prices fall with the zone price (nuclear 61.6 against 74.4 €/MWh, offshore wind 54.4 against 64.6), while strike prices stay at 79–81. The CfD top-up therefore triples for nuclear and almost doubles for offshore wind; total support rises to 1.9 and 1.4 billion €/yr.
- System cost rises about fourfold for nuclear (+149 → +583 M€/yr) and twofold for offshore wind (+329 → +648). Placed freely, nuclear is cheaper; in SE-S the two cost about the same.
- Nordic consumers gain more from SE-S placement (−5.5 against −3.1 billion €/yr on the electricity bill), but this is a transfer from producers and taxpayers, not a system gain.
- The new capacity mainly displaces solar (−9 to −11 TWh/yr); in SE-S it also pushes out onshore wind (−4 to −5 TWh/yr).
It is interesting to see the changes in consumer/producer surplus for each of the four alternatives.
| M€/yr | +5 GW nuclear free | +5 GW nuclear SE-S | +8.9 GW offshore free | +8.9 GW offshore SE-S |
|---|---|---|---|---|
| Nordics | ||||
| Consumers | +2,907 | +5,238 | +2,922 | +4,763 |
| Producers | −1,376 | −3,958 | −1,881 | −4,006 |
| Grid (congestion income, Nordic share) | −239 | +20 | −113 | +82 |
| State, CfD settlement | −300 | −818 | −828 | −1,009 |
| State, loan guarantee | −1,070 | −1,070 | −467 | −467 |
| Nordic welfare | −77 | −588 | −366 | −636 |
| Continent | ||||
| Continental welfare (cheaper imports + share of cable income) | −51 | +1 | +50 | −11 |
| Total welfare, Nordics + continent | −129 | −587 | −317 | −647 |
| For comparison: −Δ system cost (expansion) | −149 | −583 | −329 | −648 |
- Forcing the capacity in costs the Nordics money in every case.
- Most of what moves is a transfer, not a cost: consumers gain billions from lower prices, producers lose almost as much, and the net is small.
- The state’s support is large in all cases; for nuclear it is mainly the loan guarantee, for offshore wind mainly the CfD top-up.
- In the SE-S placement alternative the price falls the most, so the new plants earn less in the market and need a larger top-up.
- Placed freely, nuclear is the cheapest option for the Nordics, even though the state pays about the same as for offshore wind.
- The continent comes out roughly even: cheaper imports are offset by lower congestion income on the cables.
Finally, a look at the gains/losses per Nordic country, for each alternative.
| +5 GW nuclear, free, M€/yr | Sweden | Norway | Denmark | Finland | Nordics |
|---|---|---|---|---|---|
| Consumers | +790 | +605 | +494 | +1,018 | +2,907 |
| Producers | −776 | −556 | +592 | −636 | −1,376 |
| State + grid | −111 | −113 | −1,105 | −280 | −1,609 |
| Balance | −97 | −64 | −19 | +102 | −77 |
| +5 GW nuclear, SE-S, M€/yr | Sweden | Norway | Denmark | Finland | Nordics |
|---|---|---|---|---|---|
| Consumers | +3,311 | +1,205 | +203 | +519 | +5,238 |
| Producers | −2,183 | −1,217 | −34 | −524 | −3,958 |
| State + grid | −1,803 | −41 | −59 | +34 | −1,869 |
| Balance | −675 | −53 | +110 | +30 | −588 |
| +8.9 GW offshore wind, free, M€/yr | Sweden | Norway | Denmark | Finland | Nordics |
|---|---|---|---|---|---|
| Consumers | +1,181 | +848 | +543 | +351 | +2,922 |
| Producers | −1,110 | −544 | +110 | −337 | −1,881 |
| State + grid | −178 | −334 | −891 | −4 | −1,407 |
| Balance | −107 | −31 | −239 | +10 | −366 |
| +8.9 GW offshore wind, SE-S, M€/yr | Sweden | Norway | Denmark | Finland | Nordics |
|---|---|---|---|---|---|
| Consumers | +2,979 | +1,125 | +177 | +482 | +4,763 |
| Producers | −2,407 | −1,063 | −47 | −488 | −4,006 |
| State + grid | −1,338 | −53 | −33 | +31 | −1,393 |
| Balance | −766 | +9 | +97 | +24 | −636 |
Change in welfare per country against the base, M€/yr (+ = gain). Nuclear +5 GW (free = 4.2 GW DK + 0.8 GW FI) and offshore wind +8.9 GW (free = DK, NO-S, SE-S). Consumers: electricity bill incl. flexible sector demand, net of the sectors’ own costs. Producers: market income minus running and capital costs, plus CfD income and the cheaper financing from the loan guarantee. State + grid: CfD settlement and loan guarantee paid by the country where the capacity is built, plus congestion income (internal cables shared equally, continental cables 50/50 with the continent).
- Nuclear, placed freely: the cost is spread thinly. Denmark pays 1.1 billion €/yr in support but gets almost all of it back, since the new plants’ financing and CfD income stay in the country (−19 M€/yr). Finland comes out ahead (+102), and the Nordic total is the smallest of the four cases (−77).
- Nuclear and offshore wind in SE-S: Sweden carries the whole cost (−675 and −766 M€/yr), more than the Nordic total, while its neighbours break even or gain a little. Denmark gains the most (+110 and +97), because Danish producers lose less when Danish exports are not crowded out.
- Offshore wind, placed freely: Denmark loses the most (−239 M€/yr). It carries the largest support bill and sees the lowest prices; the other countries are close to even.
The model’s “free” placement of nuclear, mostly in Denmark, provides both the cheapest overall solution (balance -77 M€/year) for the Nordics as well as the most balanced spread of the costs. The forced placement in Sweden gives cheaper power for consumers, especially in Sweden, but all the net cost is also carried by Sweden, the other countries effectively having a net gain. Thus, in the forced placement of nuclear (or offshore wind power) in southern Sweden, a premium is paid to obtain lower consumer prices.
A future build out should be coordinated in the Nordics and consider these welfare effects.
Appendix: a 40-year support period instead of 60
All nuclear figures above assume that the investment is paid off over the plant’s 60-year life. A CfD will more likely run for 40 years. Below is what changes for the case with 5 GW of nuclear forced into SE-S, with the same 4 % WACC, the same costs and the same dispatch (capture price 61.6 €/MWh, 36.3 TWh/yr).
The strike price rises by 8 €/MWh, from 81.3 to 89.4. The annual capital cost goes up by about 12 % (569 against 510 k€/MW/yr), because the same investment must be repaid in 40 years instead of 60. The top-up is the difference between the strike price and the capture price. It therefore rises much more, by 41 %: from 19.7 to 27.9 €/MWh, or from 0.72 to 1.01 billion €/yr for the nuclear alone.
The loan guarantee falls slightly, from 1,070 to 1,007 M€/yr. A shorter loan is repaid faster, so the state carries the risk on a smaller outstanding debt.
Total support rises by about 230 M€/yr, from 1.9 to 2.1 billion €/yr, but only during the 40 support years. The reactors then run for another 20 years without support.
System cost and welfare do not change. The plant, its output and its 60-year life are the same, and the CfD is a transfer between the state and the producer. The 40-year contract only moves the payments forward in time. In present value at the start of operation (4 %), the nuclear top-up comes to 20 billion € over 40 years, against 16 billion € over 60 years.
| 60 years | 40 years | Change | |
|---|---|---|---|
| New nuclear, €/MWh | |||
| Annual capital cost at 4 %, k€/MW/yr | 510 | 569 | +59 |
| Strike price | 81.3 | 89.4 | +8.2 |
| Capture price | 61.6 | 61.6 | ±0 |
| Top-up (strike − capture) | 19.7 | 27.9 | +8.2 |
| State support, M€/yr | |||
| CfD top-up, new nuclear | 716 | 1,012 | +296 |
| CfD top-up, all procured capacity | 819 | 1,115 | +296 |
| Loan guarantee (6 % − 4 %) | 1,070 | 1,007 | −63 |
| Total support | 1,889 | 2,122 | +233 |
| Per forced MWh, €/MWh | |||
| CfD top-up | 22.9 | 31.1 | +8.2 |
| Loan guarantee | 29.9 | 28.1 | −1.8 |
| Total support | 52.7 | 59.2 | +6.5 |
| Nuclear top-up over the support period, billion € | |||
| Sum | 43.0 | 40.5 | −2.5 |
| Present value at start of operation | 16.2 | 20.0 | +3.8 |
| Unchanged | |||
| System cost, M€/yr | +583 | +583 | ±0 |
| Consumers (gain), M€/yr | +5,238 | +5,238 | ±0 |
The nuclear in Denmark case in more detail
The models free expansion placed 4.2 GW out of the specified 5 GW in Denmark, which gave the most cost effective total solution. Here is this case condensed in a table
| Base | +5 GW nuclear, free | Change | |
|---|---|---|---|
| Price, €/MWh | |||
| Mean price | 79.6 | 70.8 | −8.7 |
| Median | 81.9 | 73.2 | −8.7 |
| 10th / 90th percentile | 14.4 / 122.8 | 15.2 / 110.5 | +0.8 / −12.3 |
| Hours below 1 €/MWh, per year | 246 | 150 | −96 |
| Hours above 200 €/MWh, per year | 75 | 38 | −37 |
| Energy balance, TWh/yr | |||
| New nuclear | 0 | 30.2 | +30.2 |
| Solar | 36.7 | 29.0 | −7.6 |
| CHP / thermal | 9.6 | 7.4 | −2.1 |
| Onshore wind | 15.9 | 16.2 | +0.3 |
| Offshore wind | 10.0 | 10.1 | +0.1 |
| Total production | 72.1 | 92.9 | +20.8 |
| Curtailment | 3.1 | 1.8 | −1.4 |
| Electricity to heat (heat pumps, electric boilers) | 1.7 | 3.3 | +1.5 |
| Synchronous condenser losses | 0.5 | 0.2 | −0.4 |
| Net export to the continent | −3.2 | +12.1 | +15.3 |
| Net export to the Nordics (SE, NO) | −6.4 | −2.1 | +4.3 |
| Total net export | −9.6 | +10.1 | +19.6 |
| State support to the Danish nuclear, 60-year / 40-year repayment | |||
| Capture price, €/MWh | – | 73.9 | – |
| Strike price, €/MWh | – | 80.9 / 89.2 | – |
| CfD top-up, €/MWh | – | 7.0 / 15.3 | – |
| CfD top-up, M€/yr | – | 212 / 462 | – |
| Loan guarantee (6 % − 4 %), M€/yr | – | 902 / 848 | – |
| Total support, M€/yr | – | 1,114 / 1,310 | – |
| Total support, €/MWh | – | 36.8 / 43.3 | – |
| CfD present value at start of operation (4 %), billion € | – | 4.8 / 9.1 | – |
| Welfare in Denmark, change against base, M€/yr | |||
| Consumers | – | – | +494 |
| Producers, total | – | – | +592 |
| of which existing producers | – | – | −384 |
| of which new nuclear incl. CfD and loan guarantee value | – | – | +976 |
| Grid (congestion income, incl. continental share) | – | – | +5 |
| State (CfD + loan guarantee) | – | – | −1,113 |
| Denmark, net | – | – | −22 |
From a welfare point of view, the gain from lower consumer prices and the new nuclear’s income, much of it from higher exports, almost perfectly balances the Danish state’s cost for CfD support and loan guarantees (net −22 M€/yr). However existing Danish producers (2040) lose 20% of their revenue.