
Bengt J. Olsson
LinkedIn: beos
X/Twitter: @bengtxyz
Using the NordPSA model, four alternative scenarios were explored for possible build-out of nuclear in the Nordic countries. The four scenarios are
- Baseline. Using the NordPSA baseline for 2040 (with costs and other conditions in accordance with the Swedish TSO, Svenska Kraftnät, in their report “Långsiktig marknadsanalys 2026”, LMA26). The baseline uses a 6% discount rate for all production. The model also includes stability requirements in form rotational inertia and short circuit strength. No limits on nuclear build-out in any country (which currently Denmark has).
- Baseline with 3% instead of 6% discount rate for nuclear and offshore wind power build-out, no other changes. The aim is to simulate loan subsidies by loans guaranteed by the government that decreases the interest rate.
- Baseline with 3% discount rate, 25% higher build cost for nuclear and offshore wind power, and 10 year instead of 7 year build time for nuclear.
- Same as scenario 3, but with stability requirements removed (to check if nuclear in DK is dependent on the these requirements or not)
Note that all Nordic countries are treated equal in this experiment. That is, it is allowed to build nuclear anywhere, and the same discount rates are applied everywhere. It simulates a coordinated approach, where the Nordic countries acts together as one large country divided into six zones.
Results
| Case | Discount rate | Nuclear | Offshore wind | ||||
|---|---|---|---|---|---|---|---|
| Build time (yr) | OC excl. IDC | OC incl. IDC | Build time (yr) | OC excl. IDC | OC incl. IDC | ||
| 1. Baseline 6% discount rate | 6% | 7 | 6,250 | 7,563 | 3 | 2,400 | 2,616 |
| 2. Loan subsidies, 3% discount rate | 3% | 7 | 6,250 | 6,906 | 3 | 2,400 | 2,508 |
| 3. Loan subsidies, 3%, 25% higher cost nuclear and offshore wind, +3 years build time nuclear | 3% | 10 | 7,813 | 8,984 | 3 | 3,000 | 3,135 |
| 4. As 3, no stability reqs | 3% | 10 | 7,813 | 8,984 | 3 | 3,000 | 3,135 |
Scenario 1, baseline
Costs for nuclear in the baseline are 6,250 €/kW overnight, and 7 year build time, both taken from LMA26. The model accumulate the interest during the build time and add it to overnight cost (OC). The table above summarizes the capital costs for nuclear and offshore wind for the four scenarios.
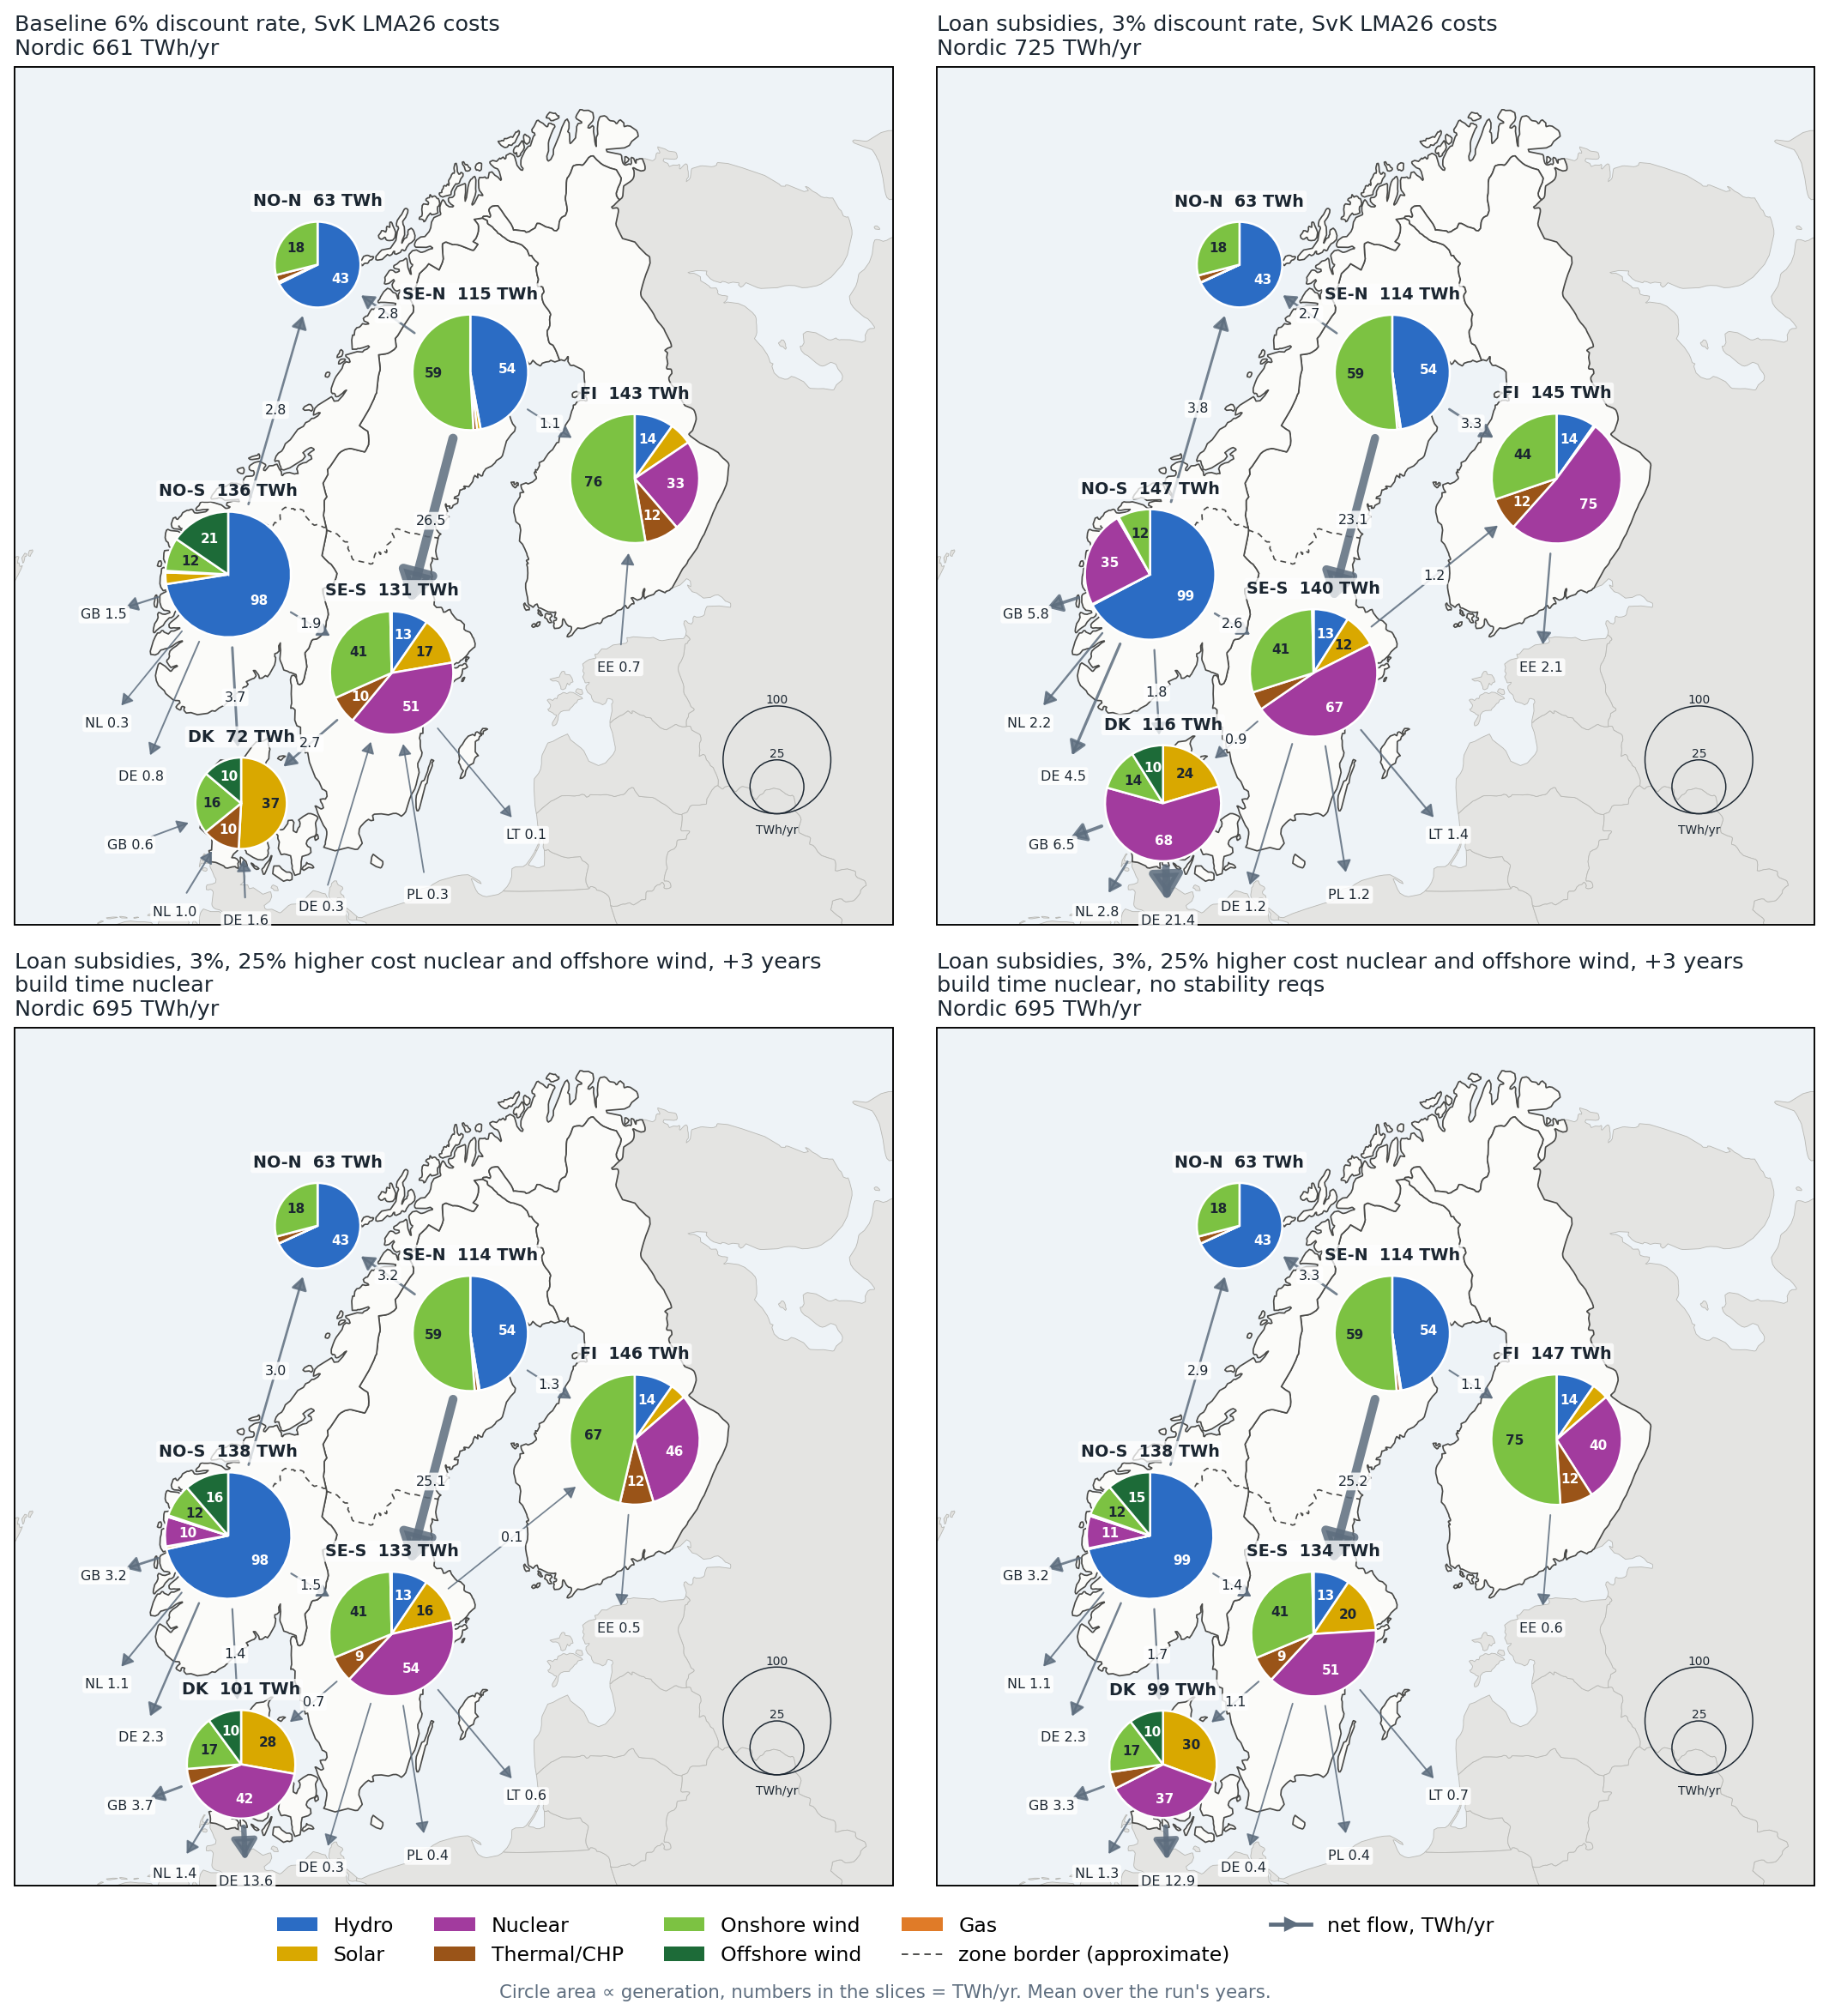
In the baseline, with 6% discount rate, no nuclear is build anywhere. In the south of Norway, offshore wind power is built, but nowhere else. Onshore wind is build to its predefined potential, and especially Denmark heavily builds out solar power. The models include stability requirements, where the most important is that the SCR (short circuit ratio) should be above 2 for each zone (see the discussion on stability requirements here). This means that Denmark builds 4 GVA synchronous condenser capacity (in addition to the existing 2 GVA), to increase the network strength and sustain the large build-out of solar. Also Finland builds 1.8 GVA, but Sweden and Norway have sufficient strength with existing hydro and nuclear power.
Scenario 2, loan subsidies with 3% discount rate
In this scenario, the discount rate for nuclear and offshore wind power build-out is set to 3% in order to simulate governmental loan guaranties for both nuclear and offshore wind power. That is the only change. The result is a massive build-out of nuclear, more than 22 GW in total. Interestingly, almost half of this capacity, 9,6 GW is built in Denmark. South Norway and Finland build about 5 GW each and South Sweden (which already have 6.9 GW) about 2.2 GW.
Why so much in Denmark? Denmark, closely tied to Germany, has the highest average price in NordPSA, and the possibility to export large quantities to the continent. What is peculiar is that Denmark, with a potential of 27 GW offshore wind power does not build anything of this. When scrutinizing the baseline results it can be seen that offshore wind power in Denmark has a capture value which is right below its LCOE and is thus not profitable to build.
In Norway the result is opposite, prices are somewhat higher and also the capacity factor used for offshore wind is somewhat higher than in Denmark. That is enough for Norway to build out to it potential of 4.9 GW in the baseline. However with the 3% discount rate, the build-out of offshore wind is reversed, no offshore wind is built, instead 5 GW of nuclear is added.
The loan guarantees definitely favors nuclear before offshore wind even when both receives the same subsidies in form of loan guarantees. This is of course due to that the compounded interest being a much larger share of the cost for nuclear, than for offshore wind.
Scenario 3, 3% discount rate with adjusted costs for nuclear and offshore wind
In the third scenario, costs for nuclear and offshore wind is increased with 25% as compared to the LMA26 costs. Also the build time for nuclear is extended from 7 years (LMA26) to 10 years. All costs changes are tabulated above.
The more expensive nuclear reduces the amount built from 22,2 GW to 9,5 GW (DK 5,8, FI 1,8, NO-S 1,4, SE-S 0,5). Still Denmark builds the lion share of new nuclear. From an energy balance perspective Denmark cuts back about 1/4 of its solar power (9 TWh) and pivots from a net importer to a strong net exporter of power, with almost 14 TWh to Germany alone.
In this scenario, some of the offshore wind capacity in southern Norway, that disappeared in scenario 2, reappears. Norway gets both 1.4 GW of nuclear and 3.6 GW of offshore wind power.
Denmark and Finland lower their average prices with 13 €/MWh and Sweden and Norway with 7 €/MWh versus the baseline. Denmark and Finland need no additional synchronous condensers now when the have stable nuclear power.
Scenario 4, same as 3 but without stability requirements
This scenario is just a sensitivity check to make sure that the requirements on inertia and network strength doesn’t offset the investments too much. Especially for Denmark, it could be expected that nuclear would be forced in, not because of economy, but rather because the stability requirements would demand it. But the stability requirements only affect about 20% of the nuclear build out, that is Denmark still builds 5.2 GW of nuclear. The 0.5 GW in southern Sweden disappears, and Finland/Norway builds a little bit less nuclear as well.
Discussion
Scenario 3, 3% discount rate with adjusted costs is the most interesting scenario. It combines realistic build-out costs with a loan guarantee that lowers the interest costs and enables almost 10 GW of new nuclear, with more than half of that amount in Denmark.
The capture price for nuclear matches the LCOE within about 1 €/MWh (both around 69, and the average price around 67), and with an extra reimbursement for provided stability, there would only be a little need for an CfD to provide a small profit for the operators, maybe centered at 75 €/MWh?
It would certainly strengthen and balance the southern part of the Nordic region, and ease the transmission conditions in the whole region. And lower the prices with 10-15% for consumers. Seems like a good deal to me!
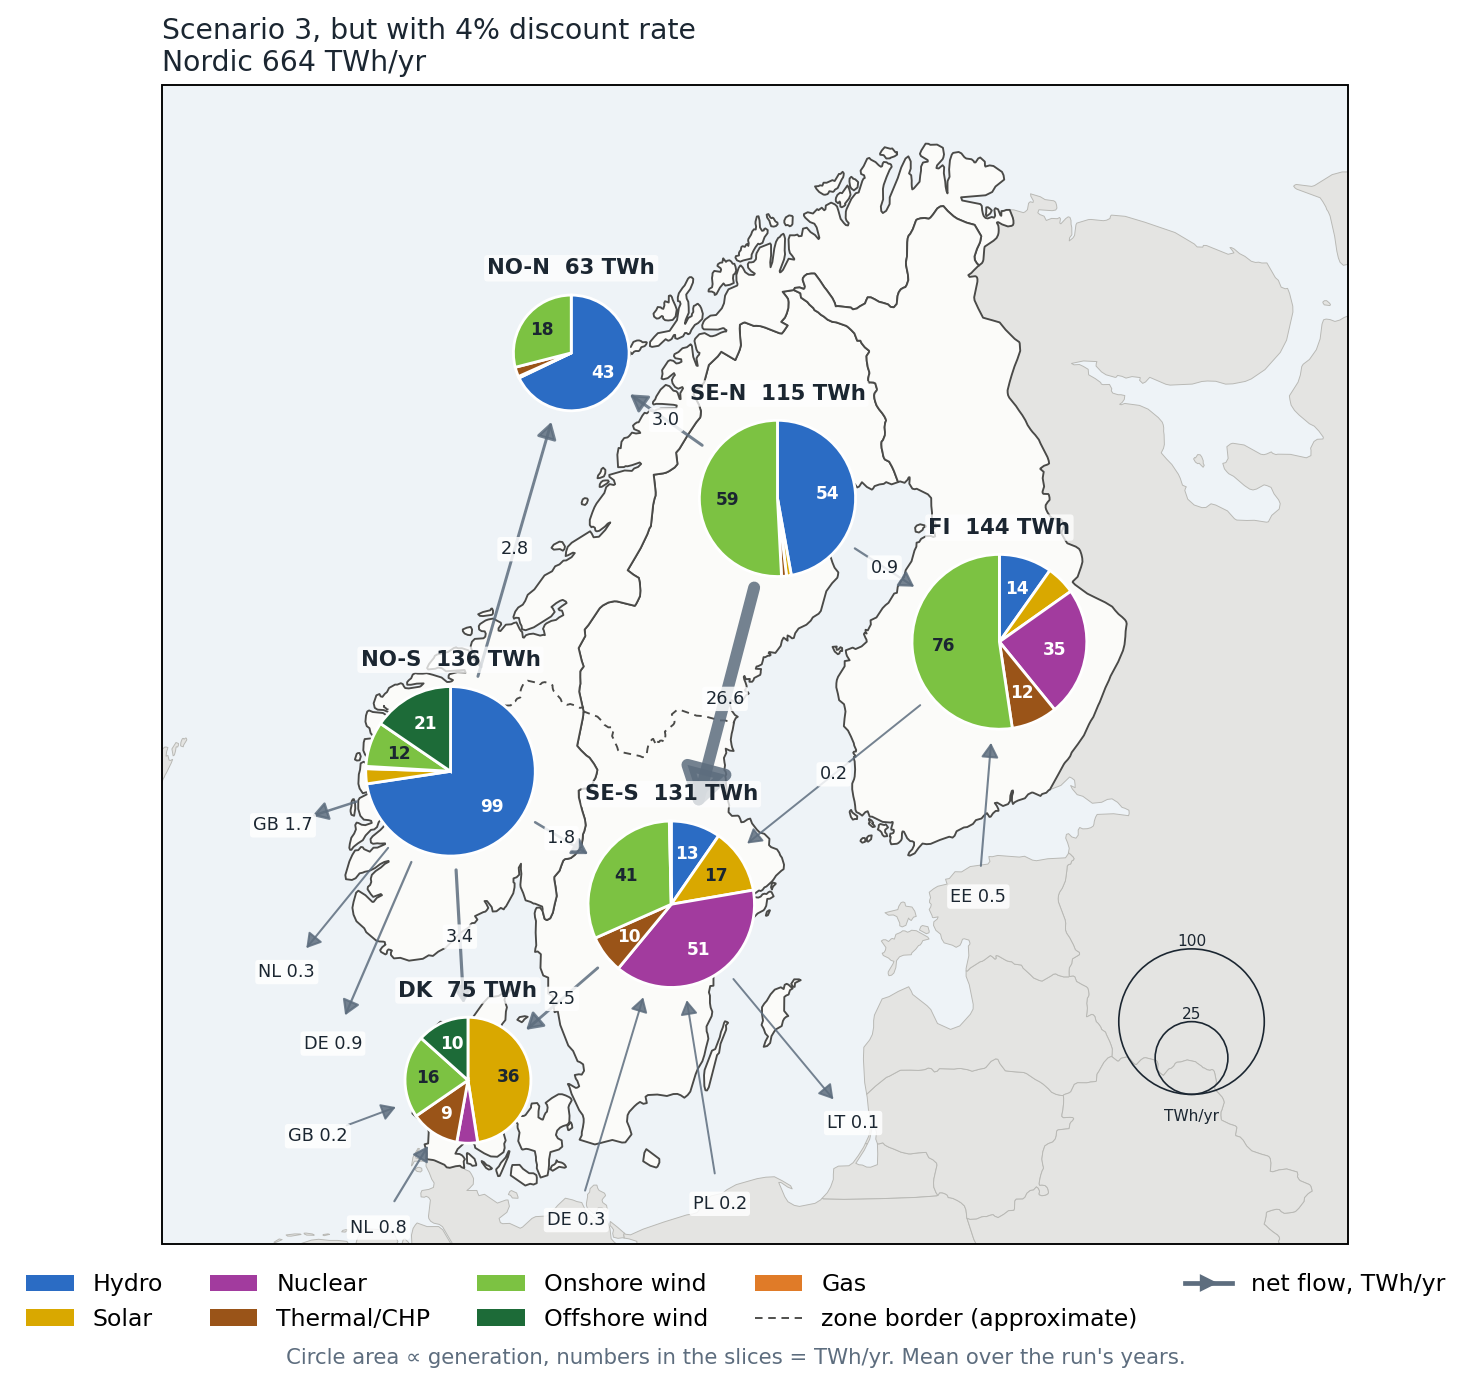
Note that the system is very sensitive to the chosen discount rate. A sensitivity run using 4% discount rate for nuclear/offshore wind power, with the +25% cost scenario, that is Scenario 3. Here almost all new nuclear is erased. Only 0,5 GW in Denmark and 0.2 GW in Finland survives the higher discount rate. The scenario reverts to the baseline with higher prices, more solar and more synchronous condensers for stability (the 2 GVA in Scenario 3 are the already present syncons).
| Scenario 1 6% | Scenario 3′ 3% -> 4% | Scenario 3 3% | |
|---|---|---|---|
| New nuclear (GW) | 0 | 0.76 (DK 0.56, FI 0.20) | 9.51 |
| Offshore wind NO-S (GW) | 4.87 (cap) | 4.87 (cap) | 3.61 |
| Solar, Nordic (GW) | 63.4 | 61.6 | 47.2 |
| Synchronous condensers (GVA) | 7.8 | 7.1 | 2.0 |
| Price (€/MWh) | |||
| Sweden | 73.7 | 72.8 | 67.1 |
| Norway | 74.0 | 73.3 | 67.5 |
| Denmark | 79.6 | 78.2 | 66.9 |
| Finland | 80.9 | 78.9 | 68.2 |
| Energy (TWh/yr) | |||
| Export to the continent | −1.9 | +1.2 | +27.0 |
| Denmark net export | −9.6 | −6.8 | +16.5 |
But how reasonable is 3%? The discount rate is the project’s average cost of capital (WACC), in real terms, i.e. excluding inflation. Suppose that the state lends to the project at its own borrowing cost, around 1% real (nominal 2,5-3% for 10-year governmental bond, minus 2% inflation => 0,5%-1% real), and a two-way CfD lowers the risk for the owners. If 75% of the project is financed by state loans at 1% and 25% by equity at 8%, the WACC becomes 0.75 × 1% + 0.25 × 8% = 2.75%. So 3% is achievable, but only if the state carries most of the risk.