Bengt J. Olsson
Twitter: @bengtxyz
LinkedIn: beos
Introduction
Model
Results
Discussion and Conclusions
Update 1: Hydrogen store instead of Battery store
Update 2: Nuclear power instead of Biopower
Introduction
The South West Interconnected System (SWIS) power system in Western Australia (WA) is quite interesting for a couple of reasons
- It is a “closed” system without electricity import or export
- The weather conditions are relatively steady and advantageous for both wind and solar power production
- It is small enough for at least considering long duration storage in form of batteries
Here is a balance model for a optimized SWIS power system consisting of Wind, Solar and thermal Biomass production and with a Battery energy store for balancing load and VRE. The model provides a cost optimized mix for the system provided estimated input cost for the different power sources.
The mix contains wind and solar power because of their low generation costs and thermal biomass power for two reasons
- To offset wind/solar power that in spite being cheap power sources, pull in a lot of battery energy storage which is expensive
- To provide system services such as inertia and frequency control
Batteries serves as backup during low solar/wind production.
Model
The model is a power/energy balance model that do an hour-by-hour matching of power production and consumption.
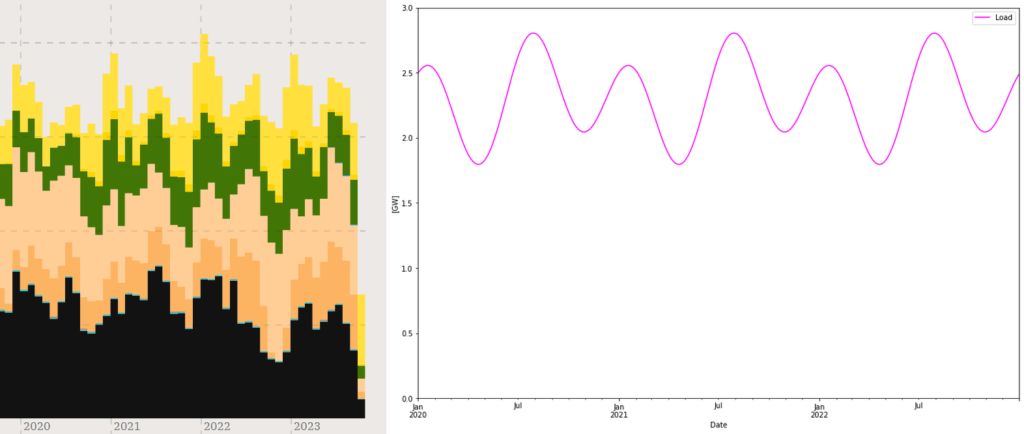
Consumption (or “load”) is modelled as described in the figure above. With this model the peak consumption becomes 3.3 GW (2.8 GW as in the figure above plus 0.5 GW from daily variation). Thus it may not catch sudden peak events so some margin must be added to e.g. the battery capacity. But importantly the consumption sums up to the right about 20 TWh, and at the same time catches “most” of the variations.
Wind and Solar power is taken from AEMO for 2020-2022 and converted to hourly data1. The data series are also normalized to roughly the same installed power for each year. Solar has had a linear growth and hence need to be normalized linearly vs time. For wind it seems like a lot of wind power was added after Q3 2020, so there only the first three quarters have been changed. Here are the normalized Solar and Wind power traces.
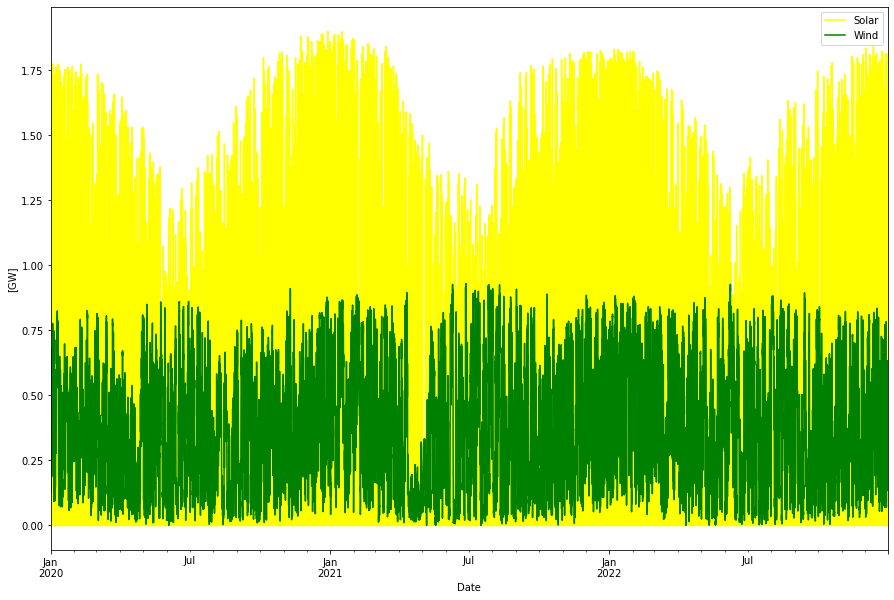
Then in the model, Wind and Solar power are individually scaled by scale factor to produce the desired production in TWh. Thermal biomass power is considered to have fixed dispatched around 1 GW with the same seasonal variation as the load.
Finally the batteries takes up the slack between the production of the three “must-run” sources and the consumption. The battery energy store is modelled as a fix sized store with an the same input and output capacity (in GW) and a storage capacity (in GWh). The round-trip efficiency of the battery energy store is set to 80%.
Economically, each source is given a CAPEX (“overnight”) cost per GW and an OPEX (per GW and/or GWh and year). An annualized cost is calculated given the lifetime of the source and a discount rate set to 6%. The yearly production of each source is then divided with the annualized cost for the source to get a per source LCOE. Also the total production and the total annualized cost is calculated to get a system LCOE that internalizes all costs. However, transmission costs are not included as well as other externalities, such as CO2 costs etc.
An optimization iteration algorithm is used to find the optimal mix, i.e. that provides the lowest total annualized cost, only subject to the condition that no power deficit must occur. It is on the other hand ok to have over-production with curtailment if this lowers the total cost.
Results
Optimal power dispatch
Given the inputs above we get the following optimal power dispatch:
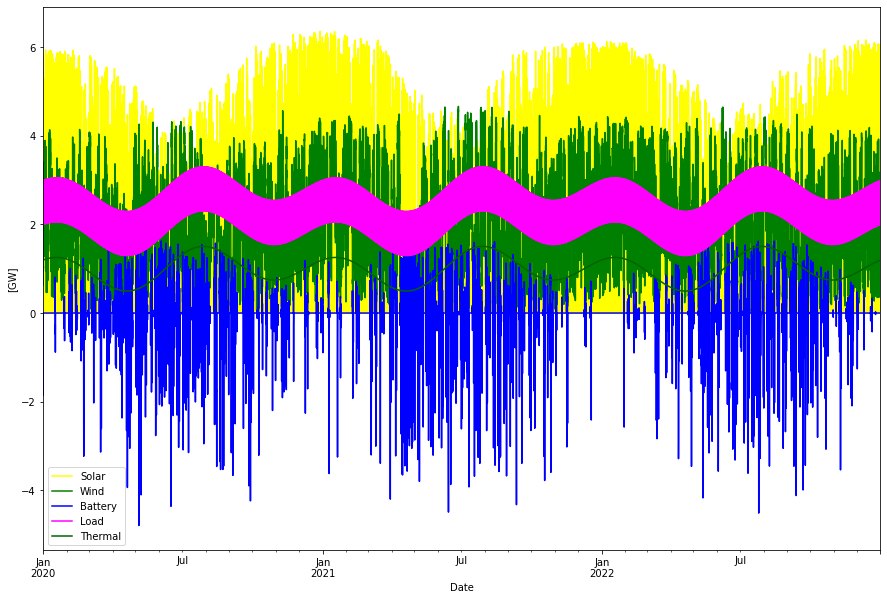
Consumption per year:          20.17 TWh
Produced wind per year:        16.81 TWh
Produced solar per year:       12.91 TWh
Produced thermal per year:      8.76 TWh
Curtailed per year             18.12 TWh
Deficit per year               -0.00 TWh
Battery charge per year        -0.97 TWh
Battery discharge per year      0.77 TWh
Max overshot:                   8.02 GW
Max shortage:                  -0.01 GW
Balance look like:
Consumed: 20.17 (Load) + 0.97 (Battery charge) + 18.12 (Curtailed) = 39.26 TWh/year
Supplied: 16.81 (Wind) + 12.91 (Solar) + 8.76 (Thermal) + 0.77 (Battery discharge) = 39.25 TWh/year
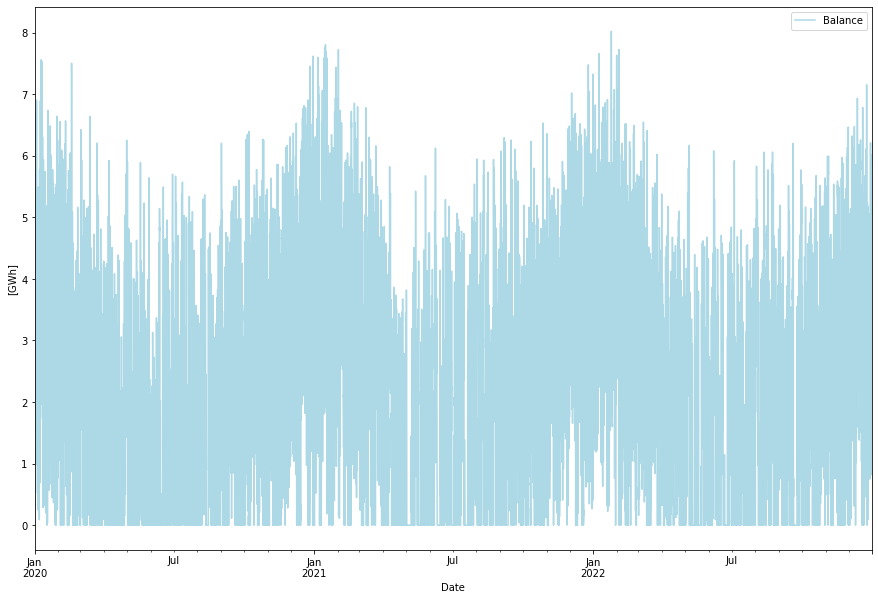
A lot of energy, almost half of what is produced is curtailed in this scenario. This is because it is relatively cheap to build wind and solar power vs having more battery storage. Here is the excess power that is curtailed.
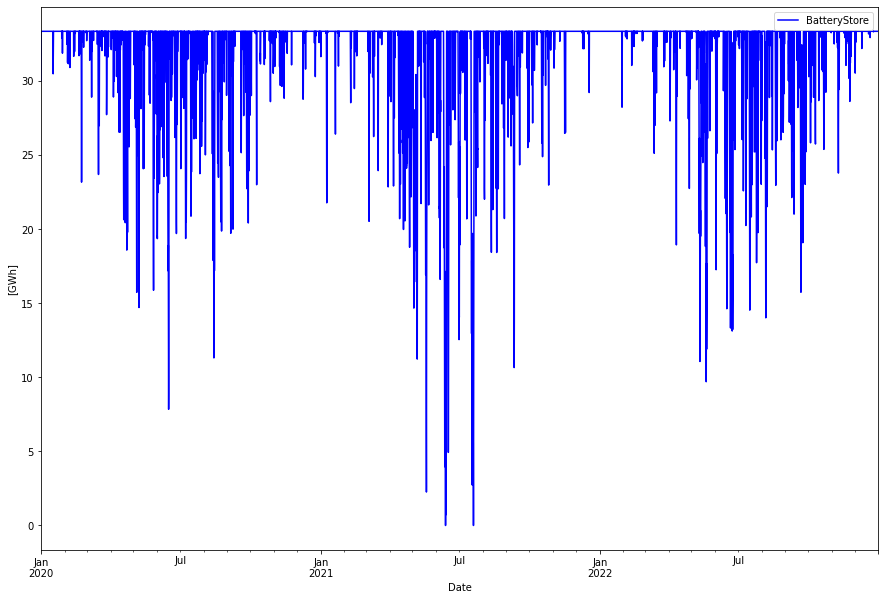
The battery energy store became 7.1 GW with 33.3 GWh storage, or a 4.7 hour battery. The storage level looks like this:
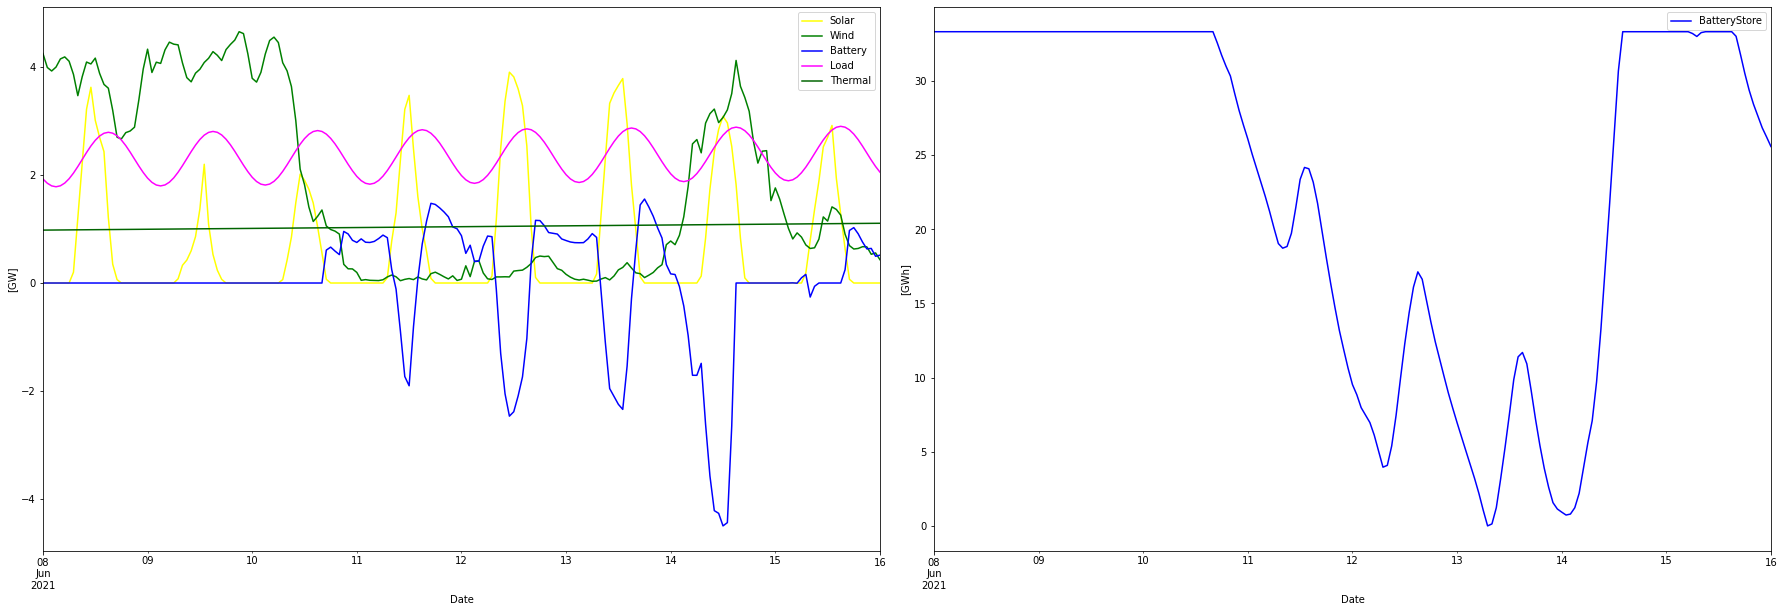
Here is a week in June expanded to easier see the balancing dynamics
Economy
All costs are in USD. In spite of the low individual LCOE for wind and solar power, the total system LCOE is pulled up by mainly the thermal biomass production, that has a high fuel cost, and by the battery cost, in spite of a low projected cost per kWh. System LCOE becomes 113 USD/MWh.
                  Installed Capacity Unit  TWh/year  CAPEX/GW(h)  OPEX/MW(h)/y   CRF  Tot CAPEX  Tot OPEX  Ann Cost    LCOE
Wind                          4.361   GW    16.807        1.000        20.000 0.078      4.361     0.087     0.428  25.484
Solar                         4.913   GW    12.912        0.500        15.000 0.078      2.457     0.074     0.266  20.591
Thermal                       1.500   GW     8.760        2.000       500.000 0.066      3.000     0.750     0.949 108.377
BatteryCapacity               7.105   GW     0.000        0.150         3.000 0.078      1.066     0.021     0.105     inf
BatterySize                  33.328  GWh     0.772        0.125         3.000 0.103      4.166     0.100     0.529 685.057

Total over-night cost           15.0 GUSD
Total yearly OPEX costs          1.0 GUSD
Annualized cost               2.2772 GUSD
System LCOE                 112.9124 USD/MWh
A small notice: In the LCOE column, the actual value for the Battery Energy Store is higher then 685, since annual cost for both BatteryCapacity and BatterySize should be added. Then the production of 0.772 should be divided by this sum. Gives a LCOE of 821 USD/MWh. High cost due to low output of the batteries.
Discussion and Conclusions
The closed SWIS system could become a completely decarbonized system (if considering biomass power as carbon free), with battery backup for a cost of 15 billion USD (this is before deducting what can be reused), implying a system LCOE of 113 USD/MWh. This should be considered the lower cost limit since the weather statistics in only for three years and it is likely that more battery storage will be needed to account for more unfavorable weather statistics.
Installed wind and solar is approximately 5 and 3.3 times higher than today respectively. The high capacity factors for wind and solar power makes these attractive power sources in WA.
The biopower component provides stable base load power and supplies system services to the power network. It was arbitrarily chosen to be 1.5 GW (with a mean power output of 1 GW => 8.76 TWh per year). If also the level of biomass power is included in the optimization, 30% less biopower is suggested (since it is expensive) and instead 50% more wind and 20% more solar power. The battery storage increased somewhat to 38 GWh. This system has a 10% higher CAPEX cost but the same system LCOE of 113 USD/MWh, since fuel costs (OPEX) are lower.
On the other hand if biomass power is forced to an average of 1.5 GW (50% more) the CAPEX cost goes down but the LCOE is slightly increased to 114 USD/MWh. In this scenario only 3 times more wind power and 2 times more solar power than today is needed. Also the battery store goes down from 33 to 18 GWh (but now with 10 GW in/out capacity). Curtailment is down from 18 to 12 TWh due to the lower amounts of wind and solar energy.
This variation of the biomass power share in the energy mix points out the importance of having the right amount of base load power to get a well balanced power system. In an upcoming blog I will look at having a hydrogen energy store instead of batteries.
1) I would like to thank @IntermittentNRG for supplying me with the hourly power data for SWIS.
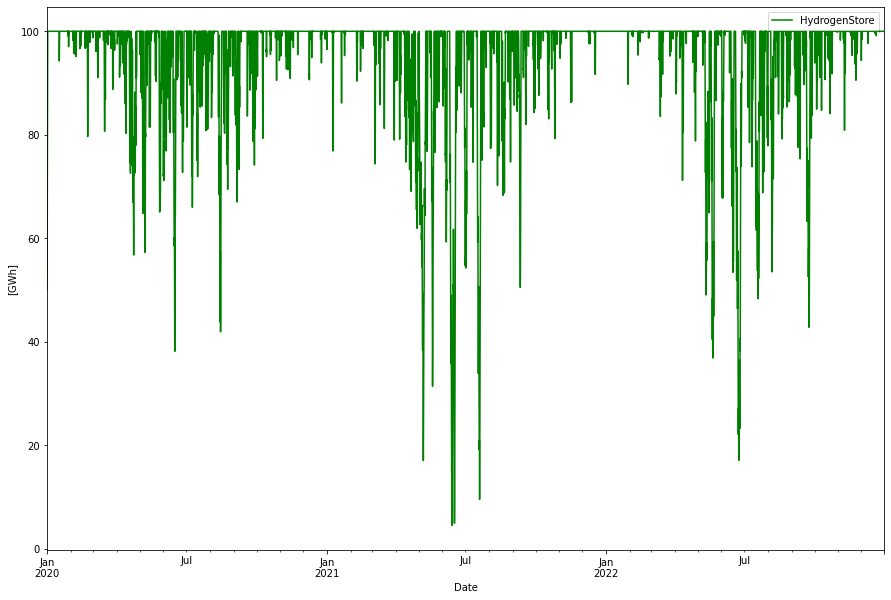
Update 2023-11-04: Hydrogen store instead of Battery Store
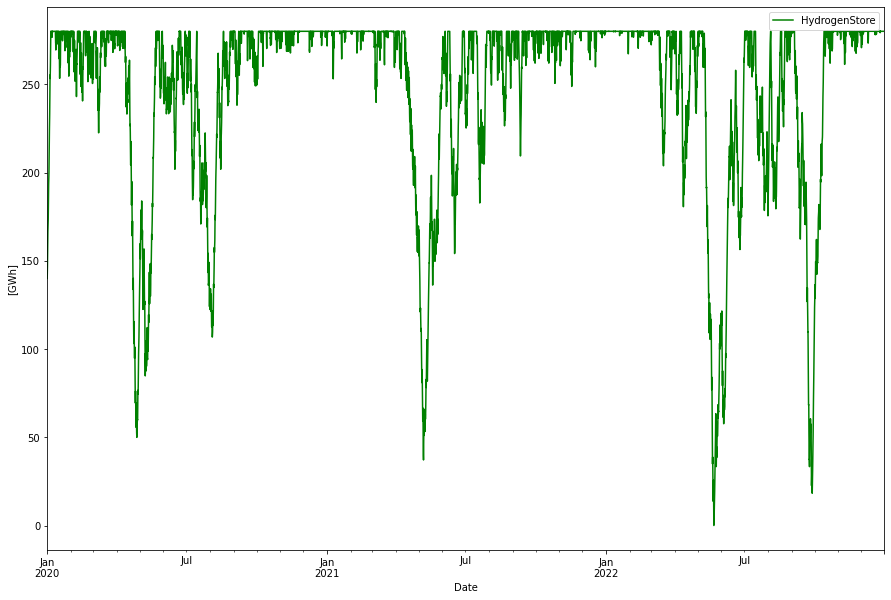
By just replacing the battery energy store with a green hydrogen energy store without any other optimizations, a 100 GWh hydrogen store is needed (measured in the energy needed to produce the hydrogen, not the H2 LHV energy value which would be of the order of 67 GWh). This is three times bigger than the battery energy store, reflecting the worser round-trip efficiency in the power->H2->power process. Also 3.5 GW electrolyzers to harvest enough of excess energy to produce the hydrogen and 1.7 GW of hydrogen CCGT capacity
The power dispatch will look identical, only difference is that instead of battery power now the same amount of hydrogen CCGT power is used as backup. Curtailment will be smaller since more energy is needed to charge the energy store. However, since otherwise curtailed this is “free” energy.
Economically we now get this table:
                  Installed Capacity Unit  TWh/year  CAPEX/GW(h)  OPEX/MW(h)/y   CRF  Tot CAPEX  Tot OPEX  Ann Cost    LCOE
Wind                          4.360   GW    16.805        1.000        20.000 0.078      4.360     0.087     0.428  25.484
Solar                         4.914   GW    12.913        0.500        15.000 0.078      2.457     0.074     0.266  20.591
Thermal                       1.500   GW     8.760        2.000       500.000 0.066      3.000     0.750     0.949 108.377
H2Store                     100.000  GWh     0.000        0.002         0.000 0.078      0.200     0.000     0.016     inf
H2Elys                        3.500   GW     0.000        0.500        15.000 0.078      1.750     0.052     0.189     inf
H2CCGT                        1.700   GW     0.772        0.750        15.000 0.078      1.275     0.025     0.125 162.187

Total over-night cost           13.0 GUSD
Total yearly OPEX costs          1.0 GUSD
Annualized cost               1.9738 GUSD
System LCOE                  97.8707 USD/MWh
This system becomes 13% lower CAPEX as well as system LCOE at 98 USD/MWh. Note however that this system has not been optimized with respect to cost, so it is possible that system LCOE can become even lower. LCOE of the Hydrogen Energy store with H2 production and electricity generation is 427 USD/MWh, almost half of the LCOE for the Battery system.
(Edit 2023-11-05: By optimizing the system, giving slightly larger storage at 127 GWh, less electrolyzer capacity, little bit more of wind and less of solar power, the system LCOE came down to 93 USD/MWh or almost 18% lower than the default battery storage scenario).
This system also have the opportunity to harvest more hydrogen for industrial applications as well. But this will be discussed in another post.
Update 2023-11-05: Nuclear instead of Biopower
Another variation on the theme: Replacing biopower with nuclear power. In this scenario, instead of 1 GW (mean) biopower a fixed dispatch from 4 nuclear plants, each of 300 MW, is simulated. Up- and down-times are simulated according to a Markov process, resulting in a 89% capacity utilization and hence about 1.07 GW in mean power dispatch. A CAPEX cost of 5 GUSD/GW and OPEX of 250 MUSD/GW/year is used for the nuclear power. The hydrogen store as backup is kept since it is cheaper than batteries.
The optimized solution interestingly increased the size of the hydrogen store to about 280 GWh and decreased the wind power significantly. The increase of the hydrogen storage capacity is probably a consequence of that biomass power was supposed to better follow the average seasonal load (see the optimal dispatch figure above) than nuclear which has been modeled with a flat base load power character.
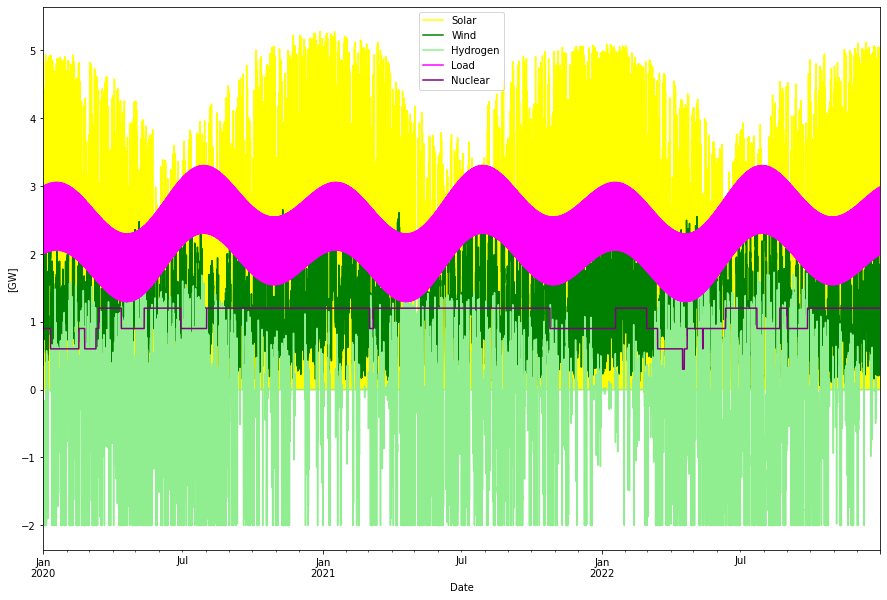
Consumption per year:          20.17 TWh
Produced wind per year:         9.77 TWh
Produced solar per year:       10.72 TWh
Produced nuclear per year:      9.37 TWh
Nuclear capacity factor:        89.03 %
Curtailed per year              7.74 TWh
Deficit per year               -0.00 TWh
Hydrogen charge per year       -3.22 TWh
Hydrogen discharge per year     1.27 TWh
Max overshot:                   5.66 GW
Max shortage:                  -0.01 GW
                  Installed Capacity Unit  TWh/year  CAPEX/GW(h)  OPEX/MW(h)/y   CRF  Tot CAPEX  Tot OPEX  Ann Cost    LCOE
Wind                          2.533   GW     9.765        1.000        20.000 0.078      2.533     0.051     0.249  25.484
Solar                         4.081   GW    10.725        0.500        15.000 0.078      2.040     0.061     0.221  20.591
Nuclear                       1.200   GW     9.368        5.000       250.000 0.062      6.000     0.300     0.671  71.657
H2Store                     280.040  GWh     0.000        0.002         0.000 0.078      0.560     0.000     0.044     inf
H2Elys                        2.005   GW     0.000        0.500        15.000 0.078      1.002     0.030     0.108     inf
H2CCGT                        1.730   GW     1.271        0.750        15.000 0.078      1.297     0.026     0.127 100.281

Total over-night cost           13.4 GUSD
Total yearly OPEX costs          0.5 GUSD
Annualized cost               1.4207 GUSD
System LCOE                  70.4449 USD/MWh
The system LCOE is now down to 70 USD/MWh. Vs the biopower/hydrogen solution all annualized costs become lower, less cost for VRE and for storage (in spite of the larger storage volume, especially electrolyzer cost came down) and also less cost for the biopower vs nuclear. Less power is curtailed as well.